Column Finance and the Social Security System 2020.05.29
【Aging, safety net and fiscal crisis in Japan】No.229: The current situation and the issue of inequality correction based on Japan's Gini coefficient

The Ministry of Health, Labor and Welfare conducts an income redistribution survey every three years to verify the effect of income redistribution through tax and social security systems. In Column No. 15, the Gini coefficient and income redistribution effect based on the 2014 survey was explained. As the government have now announced the results of the 2017 survey, I would like to revisit the issue of disparity in Japan.
The survey classifies all households into three groups: elderly households, mother & children households, and other households. It investigates how much the Gini coefficient, which represents the distribution of income flow in a group, improved for each household group after income redistribution. The Gini coefficient is 0 if it is a society with perfect equality (all the income flows are the same), whereas the Gini coefficient is 1 if it is a society with complete inequality (one person monopolizes the entire income flow). Therefore, the lower the Gini coefficient, the more equal the society.
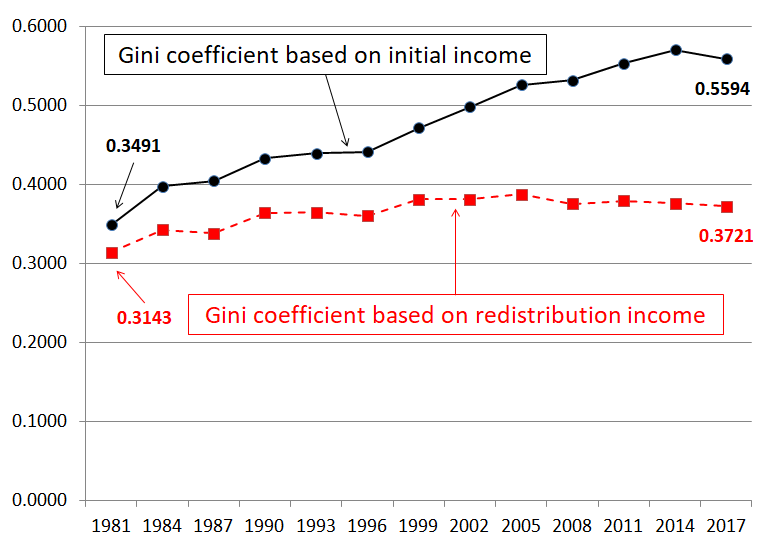
As shown in Figure 1, the Gini coefficient for the entire population before income redistribution increased from 0.3491 in 1981 to 0.5594 in 2017. There are two reasons for this. First, income disparity among working generations is widening due to an increase in the proportion of non-regular employment (see Column No. 99). Second, the proportion of elderly people with large income disparities continues to rise. Under such circumstances, it is admirable that the Gini coefficient after income redistribution is suppressed to 0.3721 due to income redistribution of the tax and social security systems.
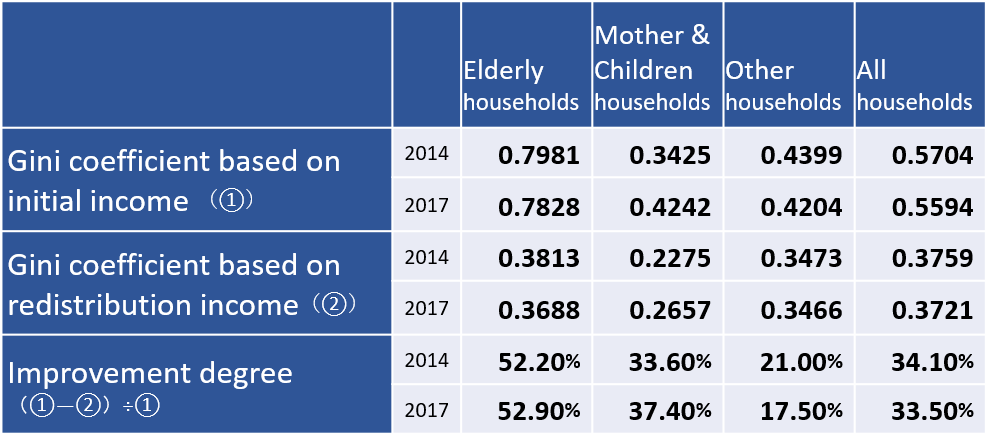
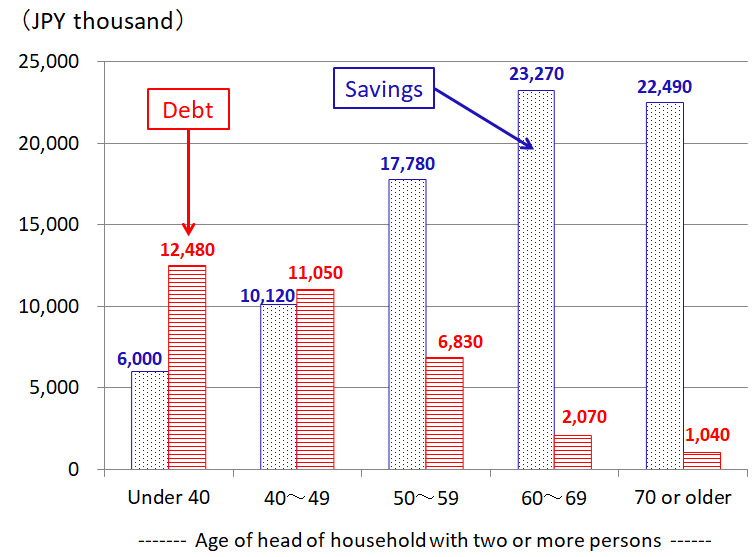
As shown in Table 1, the Gini coefficient before income redistribution of elderly households in 2017 reached 0.7828. This reflects the fact that many retired older people depend on pension incomes, while others, such as self-employed people and farmers, maintain non-pension incomes. The fact that the Gini coefficient after income redistribution improved significantly to 0.3688 indicates that the elderly benefit the most from income redistribution. The weakness of the Gini coefficient is that it only considers the flow income and does not reflect stock disparity. As shown in Figure 2, when looking at net savings, which is savings minus debt, the elderly are rich. In the economic turmoil due to the COVID-19 pandemic, the group struggling the most is the working generation. Therefore, the government needs to shift the financial resources of the tax and social security systems from the elderly to the working generation.
Figure 1 Changes in the Gini coefficient before and after income redistribution
 *Please click the table image to find the original size image.
 Source: Ministry of Health, Labor and Welfare
Table 1 Income Redistribution Effect
 *Please click the table image to find the original size image.
 Source: Ministry of Health, Labor and Welfare
Figure 2 Savings and Debt in households with two or more persons
 *Please click the table image to find the original size image.
 Source: Ministry of Internal Affairs and Communications