Column Finance and the Social Security System 2018.01.24
【Aging, safety net and fiscal crisis in Japan】No.15: Gini Coefficient and Income Redistribution Effect

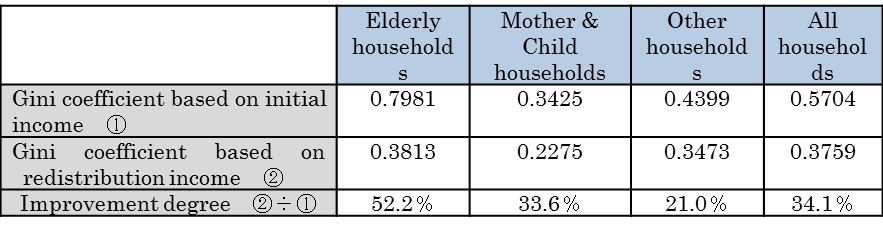
The Ministry of Health, Labor and Welfare conducts an income redistribution survey every three years in order to verify the effect of income redistribution through tax and social security systems. The survey classifies all households into three groups, Elderly households, Mother and Child households and Other households. It investigates how much the Gini coefficient of each household group improves after income redistribution. The definition of elderly households consists of only those 65 years of age or older, or such households to whom unmarried people under 18 years old have been added. The Gini coefficient represents the distribution of income flow in a group. The Gini coefficient is 0 if it is a perfect equality society (all the income flows are the same) and Gini coefficient is 1 if it is a complete inequality society (one person monopolizes the entire income flow). Therefore, the lower Gini coefficient, the more it can be evaluated as an equal society.
As Table 1 shows, the Gini coefficient for all households was 0.5704 at initial income before redistribution, down 34.0% to 0.3759 by redistribution. In particular, the degree of improvement in elderly households is as great as 52.2%. It can be appreciated that the income redistribution mechanism is fulfilling its aim.
However, the Gini coefficient has a major disadvantage. It does not take into account the financial assets held by households, resulting in the oversight that the cost burden of pension and medical care is becoming unfair from the viewpoint of stock property.
As Table 2 shows, the average financial asset amount of households whose heads are 60 years or older is obviously larger than other households. Using Table 2 data and Household statistics, I attempted to calculate what percentage of household financial assets is owned by households whose heads are 60 years or older. The result is about 65%. Therefore, there is rationality for reform that makes a patient burden (out of pocket) ratio of medical expense to be, in principle, 30% regardless of age.
(Source)Ministry of Health, Labor and Welfare
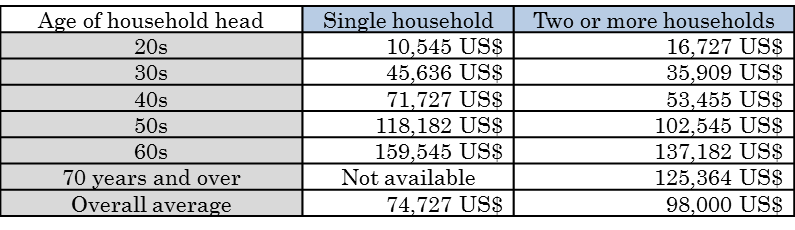
(Note)Average amount including households not holding financial assets
(Source)Financial Public Relations Central Committee