Column Finance and the Social Security System 2021.10.06
【Aging, safety net and fiscal crisis in Japan】No.332: The number of elderly workers has continued to increase even during the COVID-19 pandemic
In this column series, Yukihiro Matsuyama, Research Director at CIGS introduces the latest information about aging, safety net and fiscal crisis in Japan with data of international comparison

The Ministry of Internal Affairs and Communications reported the number of employed workers in their labor force survey. Employed workers include employees and officers employed by companies and public institutions, self-employed people, unpaid family workers, and those who are on leave due to illness or vacation.
According to a survey released by the Ministry in September 2021, the number of employed workers in FY2020 (April 2020 to March 2021) decreased to 66,760,000 from 67,240,000 in FY2019 due to the stagnation of economic activities during the COVID-19 pandemic (Figure 1). However, even under these circumstances, the number of employed workers aged 65 and over increased from 8,920,000 in FY2019 to 9,060,000 in FY2020 (Figure 2). As a result, the percentage of elderly workers increased from 13.3% to 13.6%.
The number of elderly workers has steadily increased over the last 16 years (since FY2004). According to the survey, the reason is not that they have a dire need to earn money, but that they have a strong desire to continue working so long as they are in good health. As shown in Figure 3, the employment rate of the elderly has risen in all developed countries over the past decade, but the rate in Japan, which is 25.1%, is by far the highest. Figure 4 shows the employment rate by age group in Japan. It is noteworthy that the employment rate of the elderly (those aged 70 and over) increased from 12.8% in FY2010 to 17.7% in FY2020.
Figure 1 Percentage of elderly workers of the total employed workers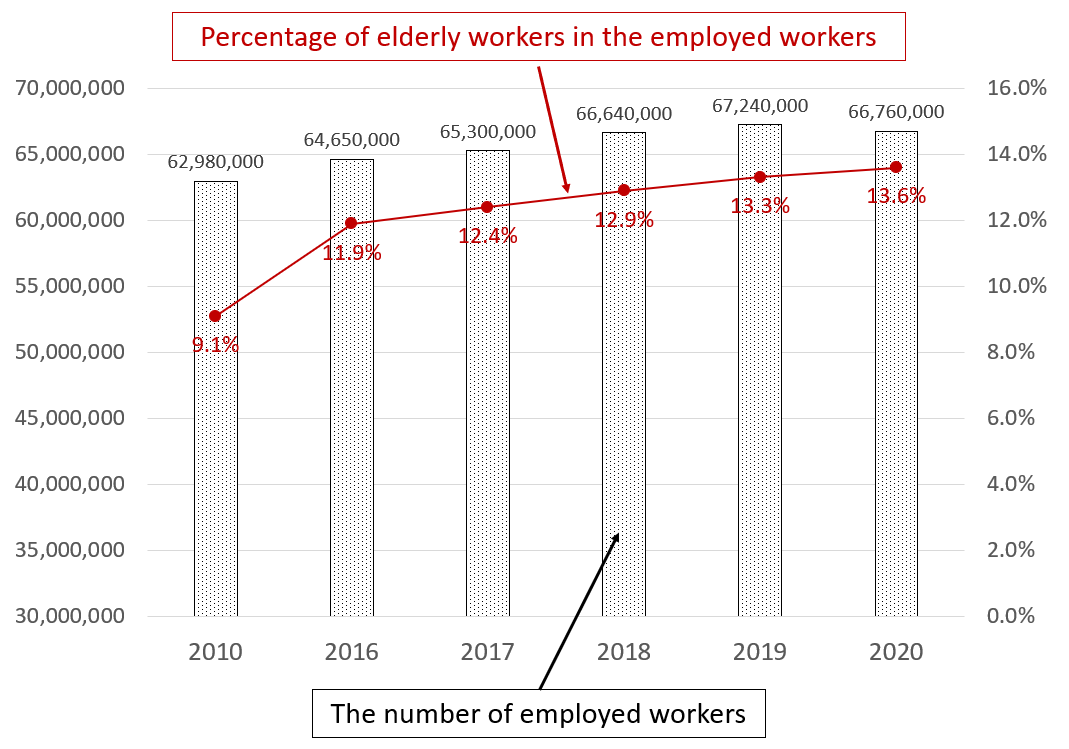
Source: The Ministry of Internal Affairs and Communications, Labor Force Survey
Figure 2 The number of employed workers aged 65 and over by gender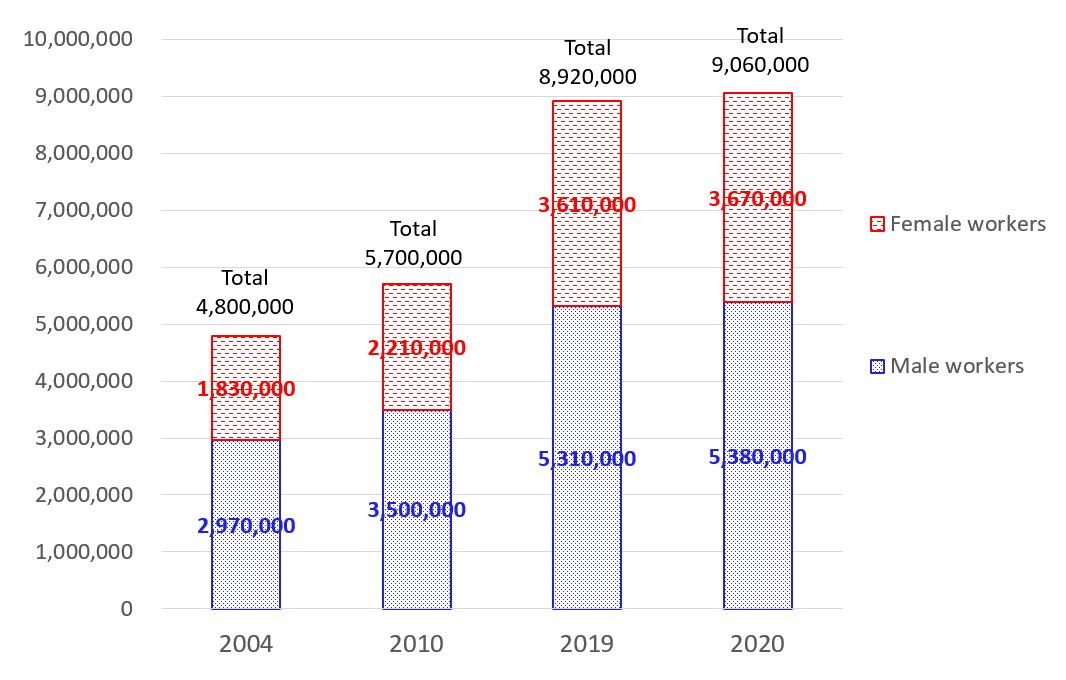
Source: The Ministry of Internal Affairs and Communications, Labor Force Survey
Figure 3 International comparison of the employment rate of the elderly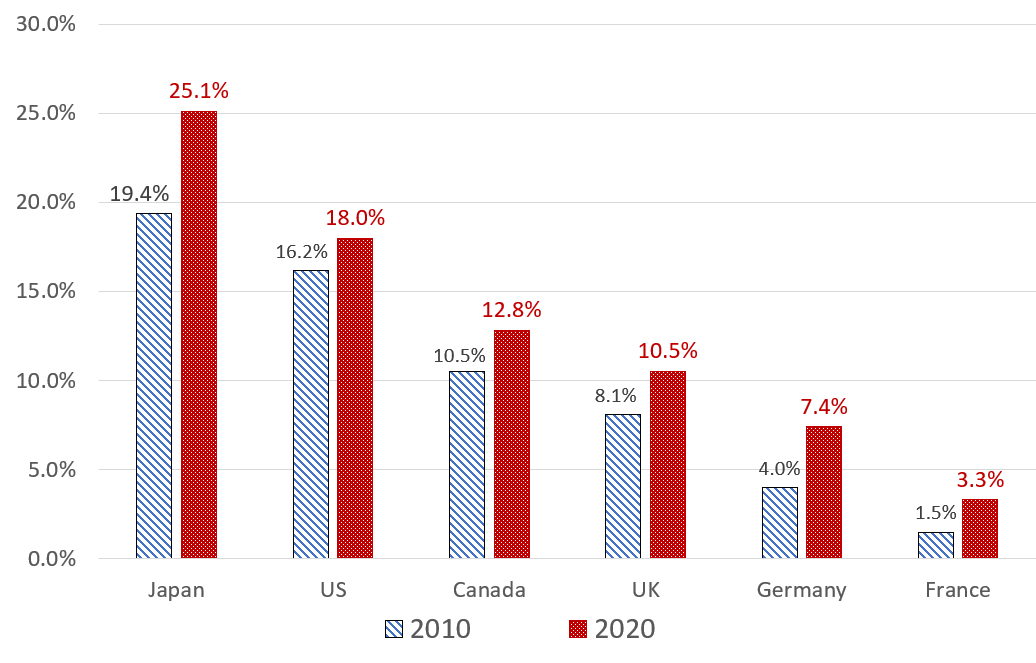
Source: The Ministry of Internal Affairs and Communications, Labor Force Survey
Figure 4 Employment rate by age group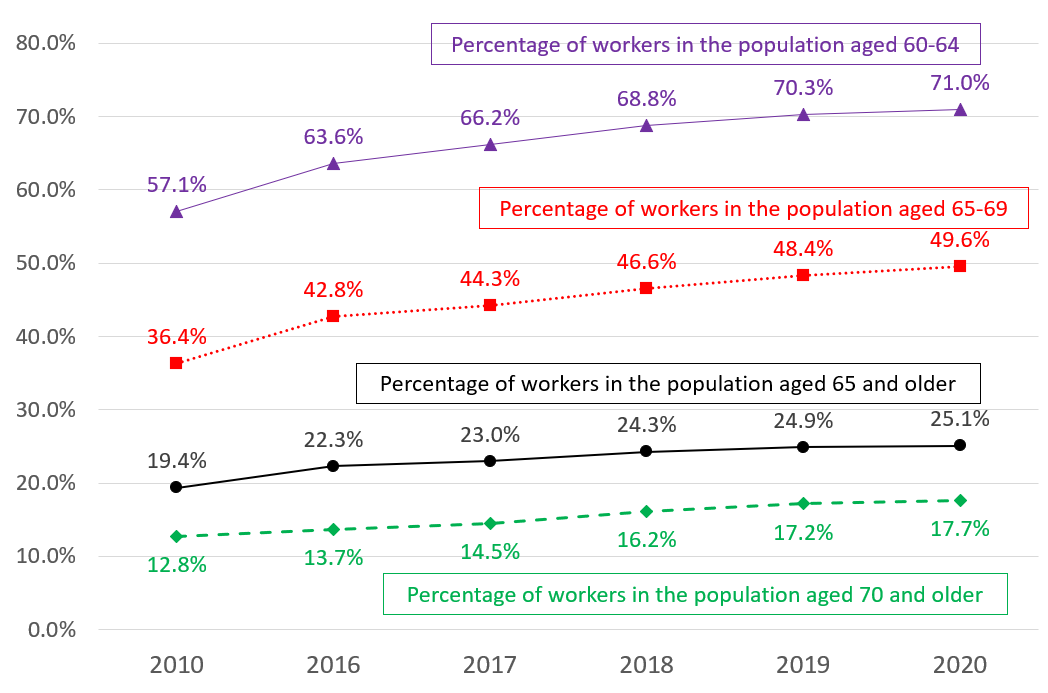
Source: The Ministry of Internal Affairs and Communications, Labor Force Survey