Column Finance and the Social Security System 2021.07.28
【Aging, safety net and fiscal crisis in Japan】No.326:Despite the increase in the number of people infected with COVID-19, consumption activities are on the rise.
In this column series, Yukihiro Matsuyama, Research Director at CIGS introduces the latest information about aging, safety net and fiscal crisis in Japan with data of international comparison
According to the national economic statistics released by the Cabinet Office, nominal disposable income increased by JPY 10,786 billion (USD 98 billion) from JPY 305,404 billion (USD 2,776 billion) in 2019 to JPY 316,190 billion (USD 2,874 billion) in 2020 (Figure 1). This shows that the government provided more than JPY 12 trillion (USD 109 billion) in 2020, which amounts to JPY 100,000 per person, as a measure against the COVID-19 pandemic. Although the purpose was to help those in need and to restore depressed consumer activity, it became clear that most of the benefit went to savings. As shown in Figure 2, savings increased by JPY 28,878 billion (USD 263 billion) from JPY 6,878 billion (USD 62 billion) in 2019 to JPY 35,756 billion (USD 325 billion) in 2020. The fact that the increase in savings was more than double the amount of benefits indicates that there was a significant decline in consumption activities throughout 2020.
The fifth wave of COVID-19 began prior to the Olympic Games, which is set to begin on July 23, 2021, and the government issued the fourth state of emergency on July 12. However, many people no longer seem willing to refrain from going out despite the state of emergency. This is also reflected by the fact that nominal consumption expenditure per household in April and May 2021, which was in the middle of the fourth wave of COVID-19, increased by more than 10% compared to the same month of the previous year (Figure 3). Furthermore, due to vaccination delays and the large flow of people, it is feared that the fifth wave will be quite large.
Figure 1: Nominal disposable income
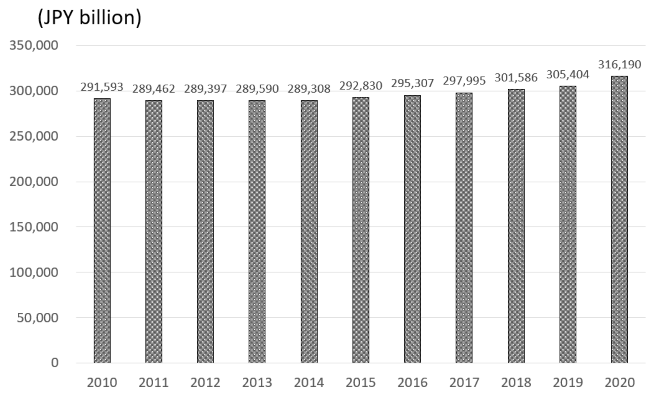
Source: Cabinet Office.
Figure 2: Savings and Savings ratio
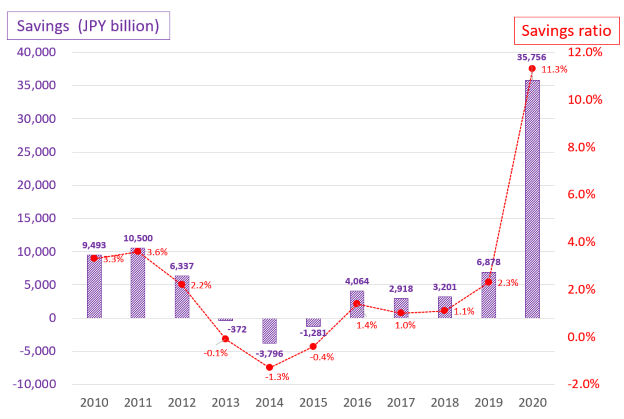
Source: Cabinet Office.
Figure 3: Nominal consumption expenditure per households with two or more people
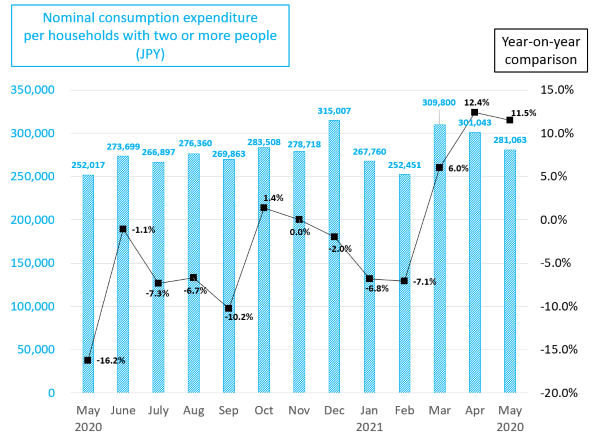
Source: Ministry of Internal Affairs and Communications.