Column Finance and the Social Security System 2021.07.28
【Aging, safety net and fiscal crisis in Japan】No.325:The tax revenues of national government reached record highs in FY2020
In this column series, Yukihiro Matsuyama, Research Director at CIGS introduces the latest information about aging, safety net and fiscal crisis in Japan with data of international comparison

According to the national fiscal settlement of FY2020 (April 2020 – March 2021), which was announced by the Ministry of Finance on July 5, 2021, tax revenues reached a record high of JPY 60.8 trillion (USD 553 billion) (Figure 1). The first reason for this is that the effect of raising the consumption tax rate from 8% to 10% in October 2019 contributed fully for one year, and as a result, the consumption tax revenues increased from JPY 18,353 billion (USD 167 billion) in FY2019 to JPY 20,971 billion (USD 191 billion) in FY2020 (Table 1). This was attributed to the fact that personal consumption, which was expected to be significantly affected by restrictions on eating out, travel, and entertainment, was supported by the increase in "consumption of nesting at home." Second, corporate tax revenues also increased from JPY 10,797 billion (USD 98 billion) in FY2019 to JPY 11,235 billion (USD 102 billion) in FY2020. The Ministry predicts that corporate tax revenues will decrease to JPY 8,997 billion in FY2021 due to the deterioration of corporate performance in FY2020 (Table 1). Figure 2 shows the changes in the structure of tax revenues for the entire government, including local governments. The ratio of consumption tax revenues to total tax revenues increased from 18.6% in FY2000 to 36.9% in FY2021, and the ratio of corporate tax in FY2021 remains relatively small at 16.7%. Therefore, the negative impact of COVID-19 damage on corporate tax revenue is within the permissible level.
Figure 1: Tax revenues of the national government
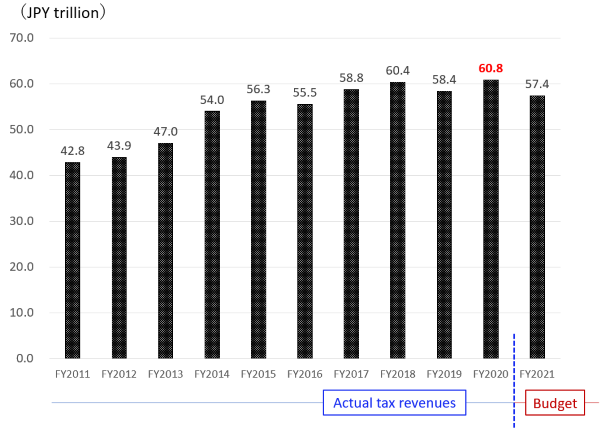
Source: Ministry of Finance.
Table 1: Breakdown of tax revenues of the national government (JPY billion)
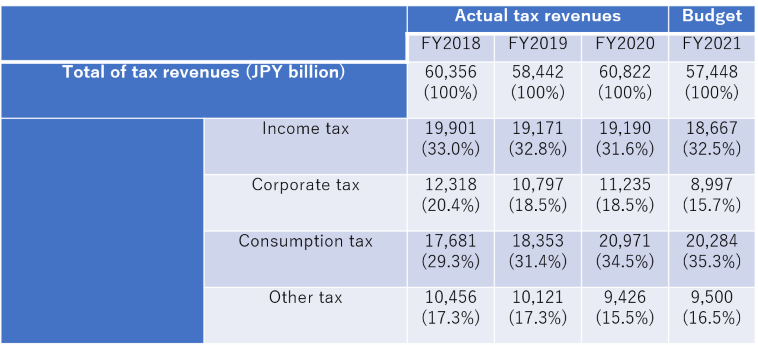
Source: Ministry of Finance.
Figure 2: The structure of tax revenues for the entire government, including local governments.
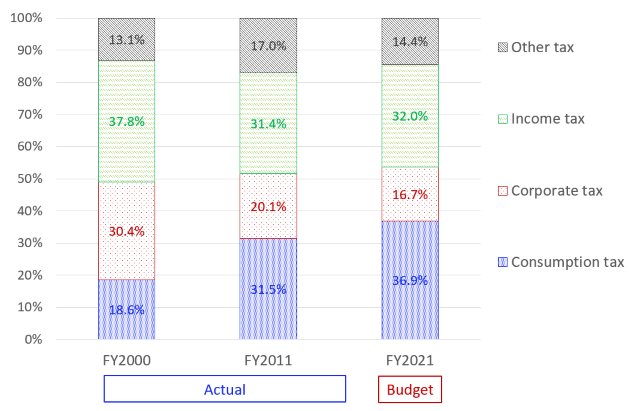
Source: Ministry of Finance.