Column Finance and the Social Security System 2021.06.29
【Aging, safety net and fiscal crisis in Japan】No.313:The fishing industry is in trouble due to the falling fish consumption and aging fishermen.
In this column series, Yukihiro Matsuyama, Research Director at CIGS introduces the latest information about aging, safety net and fiscal crisis in Japan with data of international comparison

In Japan, the domestic production of seafood products peaked at 12,055,000 tons in 1984, and then declined to 3,750,000 tons in 2019 (Figure 1). Moreover, the import volume exceeded the domestic production volume for the first time in 2000. By 2019, the import volume (4,210,000 tons) was 12.3% larger than the domestic production volume (3,750,000 tons).
Figure 2 illustrates an international comparison of annual seafood consumption per capita on a gross food basis, and this shows that the data are calculated by including discarded seafood products. In 1990, the annual per capita consumption of seafood products by Japanese people was by far the highest in the world. However, since Japanese people’s tendency to eat less fish became stronger, the nation’s annual consumption per capita was overtaken by South Korea in 2006, and then by Norway in 2010. As shown in Figure 3, by 2011, the annual consumption of meat per capita exceeded that of fish.
As a result, the number of fishermen continues to decline. For example, it decreased from 243,330 in 2002 to 144,740 in 2019, therefore implying that the average age of fishermen is rising within Japanese society. Since the number of new fishermen is less than 2,000 per year (Figure 4), this figure is expected to continue declining.
Figure 1 Domestic production and imports/exports of seafood products
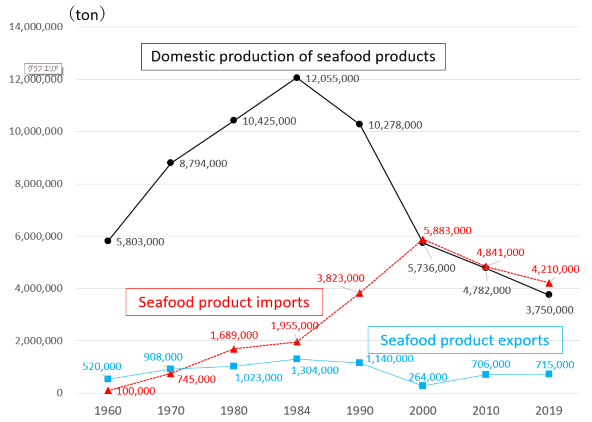
Source: Ministry of Agriculture, Forestry and Fisheries.
Figure 2 Annual seafood consumption per capita on a gross food basis
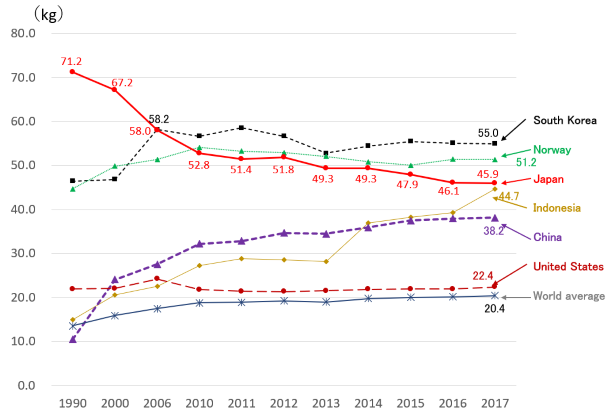
Source: Ministry of Agriculture, Forestry and Fisheries.
Figure 3 Annual consumption of meat and seafood products per capita
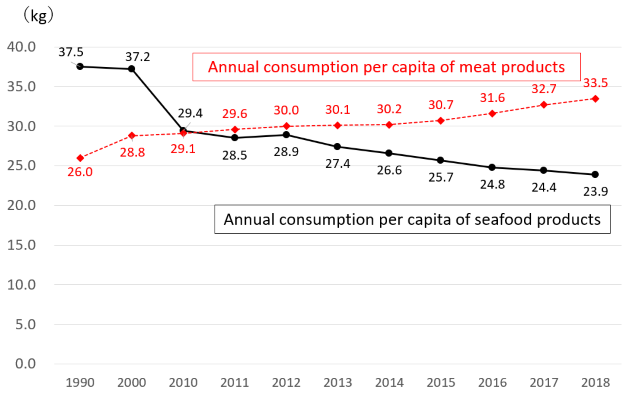
Source: Ministry of Agriculture, Forestry and Fisheries.
Table 1 The number of workers in the fishing industry per age group
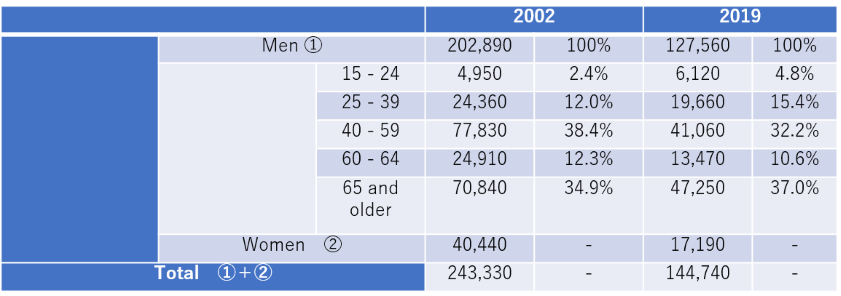
Source: Ministry of Agriculture, Forestry and Fisheries.
Figure 4 The number of new workers in the fishing industry
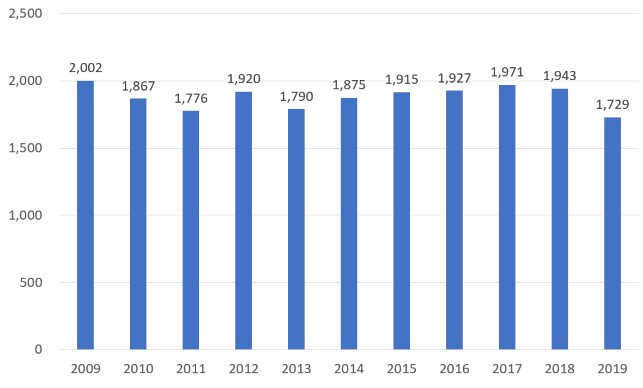
Source: Ministry of Agriculture, Forestry and Fisheries.