Column Finance and the Social Security System 2021.06.17
【Aging, safety net and fiscal crisis in Japan】No.311:The negative impact of COVID-19 on employment in Japan is lower than in other countries
In this column series, Yukihiro Matsuyama, Research Director at CIGS introduces the latest information about aging, safety net and fiscal crisis in Japan with data of international comparison
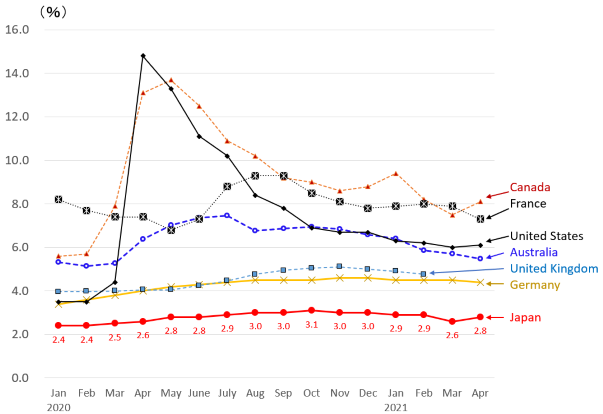
The International Labour Organization (ILO) published a report on June 2, 2021, titled World Employment and Social Outlook Trends, 2021. It is a useful source of information on the negative impact of COVID-19 on employment worldwide. In Japan, people who have lost employment due to the stagnation of social and economic activities because of the pandemic appear regularly on daily news programs. However, in terms of international comparisons of unemployment rates (Figure 1), the negative impact of COVID-19 on employment in Japan is smaller than in other countries.
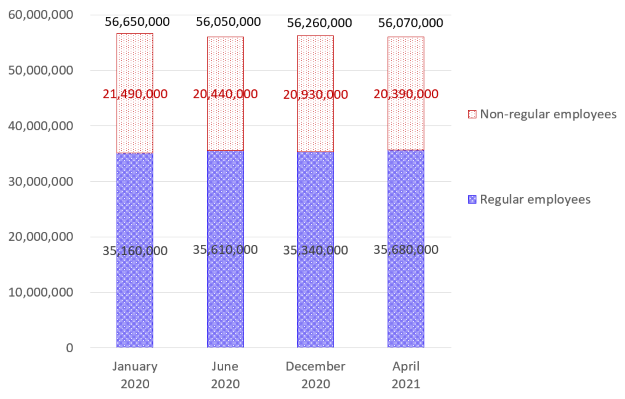
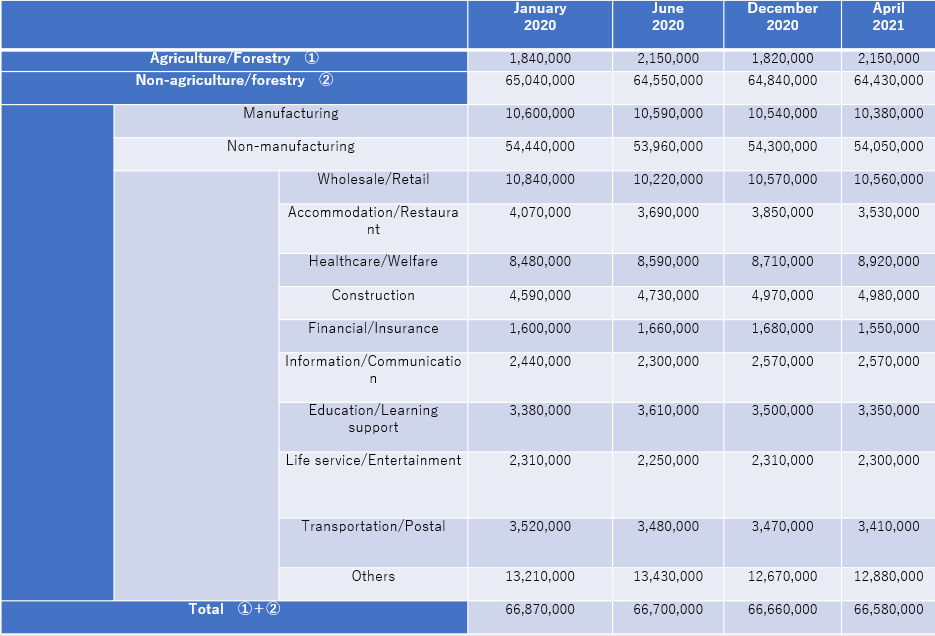
While the number of non-regular employees decreased by 1,100,000 (from 21,490,000 in January 2020 to 20,390,000 in April 2021), the number of regular employees increased by 520,000 (from 35,160,000 to 35,680,000) during the same period (Figure 2). This seems to reflect the fact that companies are working to secure necessary human resources from a medium- to long-term perspective, as the labor force population continues to decline (see Column No.263). In particular, notably, the number of regular female employees increased by 740,000 (from 11,610,000 in January 2020 to 12,350,000 in April 2021) (Table 1). Table 2 shows the changes in the number of workers during the same period per industry. It can be said that employment was supported by the small decrease rate of 2.1% (from 10,600,000 to 10,380,000) in the manufacturing industry. Although the decrease in the wholesale/retail and accommodation/restaurant service industries was significant, the increase in medical/welfare, construction, and information/communication industries contributed to employment stability.
Figure 1. International comparison of unemployment rates

Source: OECD, https://data.oecd.org/unemp/unemployment-rate.htm
Figure 2. Changes in the number of employees in Japan during the COVID-19 pandemic

Source: Ministry of Internal Affairs and Communications
Table 1. The number of employees by employment status and gender

Note: The totals do not always match because figures are rounded.
Source: Ministry of Internal Affairs and Communications
Table 2. The number of workers per industry

Note: The totals do not always match because figures are rounded.
Source: Ministry of Internal Affairs and Communications
