Column Finance and the Social Security System 2020.11.09
【Aging, safety net and fiscal crisis in Japan】No.300: Decrease of medical expenses by refraining from medical treatment to prevent the rise of COVID-19 cases
In this column series, Yukihiro Matsuyama, Research Director at CIGS introduces the latest information about aging, safety net and fiscal crisis in Japan with data of international comparison.

On October 14th, the Ministry of Health, Labour and Welfare released statistics on medical expenses (excluding long-term care expenses) for the second quarter of 2020. It clarified the impact of self-restraint on medical care, which began in March 2020 to prevent the rise of COVID-19 cases. As shown in Table 1, medical expenses for the four months from March to June 2020 decreased by 6% from JPY 14,479 billion (US$ 138 billion) to JPY 13,606 billion (US$ 130 billion) compared to the same period in 2019. While medical expenses decreased in all 47 prefectures, they decreased more in the metropolitan areas (Tokyo, Kanagawa, Saitama, Chiba) and the Kansai area (Osaka, Hyogo, Kyoto), where COVID-19 infection rates are high.
A decrease in medical expenses means that insurers’ benefit expenditures decrease, and their surplus increases. The public health insurance system in Japan is roughly divided into three categories: insurance for employees in private companies and public institutions (see Column No. 191); national health insurance for self-employed people and retired people under the age of 74 (see Column No. 192); and insurance for the elderly aged 75 and over (see Column No. 193). While the total decrease in medical expenses in public health insurance was JPY 859 billion (US$ 8.2 billion), the decrease in insurance for employees was JPY 380 billion (US$ 3.6 billion), and the rate of decrease was as large as 8.5%. Insurance premium revenues for employees are expected to decline over the next few years, as salaries decrease and unemployment increases due to the deterioration of corporate performance as a result of COVID-19. The positive effect on the finance of insurance for employees through the decrease in medical expenses is expected to be partially offset by the decrease in premium revenues.
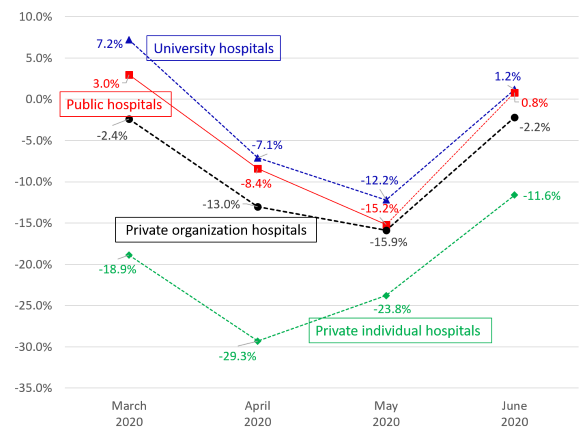
Table 3 shows the decrease in medical expenses in hospitals. There were 8,255 hospitals in June 2020, which were roughly divided into four categories according to the type of organization: university hospitals (160), public hospitals (1,524, including national hospitals, local public hospitals, red-cross hospitals, etc.), private organization hospitals (6,411, including for-profit and non-profit hospitals), and private individual hospitals (160). The decrease in medical expenses in public hospitals, JPY 197 billion (US$ 1.9 billion), accounted for about half of the total decrease of JPY 413 billion (US$ 3.9 billion). Figure 1 shows the year-on-year changes in monthly inpatient medical expenses. While inpatient medical expenses in private organization hospitals recovered to almost the previous year’s levels in June, the rates of decrease in university hospitals and public hospitals remained at -7.7% and -6.7%, respectively. Regarding outpatient medical expenses, hospitals other than private individual hospitals recovered to the previous year’s level in June (Figure 2).
Figure 3 shows the year-on-year comparison of monthly medical expenses in clinics by the clinical department. Only pediatric and otolaryngology clinics remained significantly depressed in June. Notably, home-visit nursing services increased significantly amid this period when people were refraining from seeking medical treatment.
Table 1 Decrease in medical expenses by prefecture
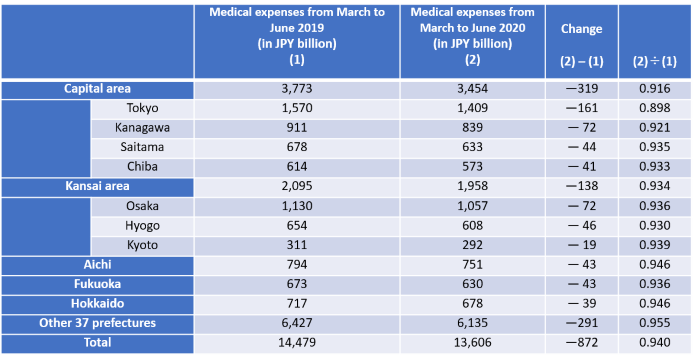
Source: Ministry of Health, Labour and Welfare
Table 2 Decrease in medical expenses by insurance
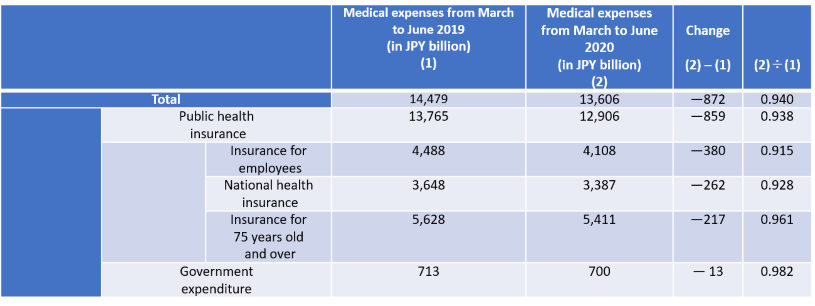
Source: Ministry of Health, Labour and Welfare
Table 3 Decrease in medical expenses by type of hospital
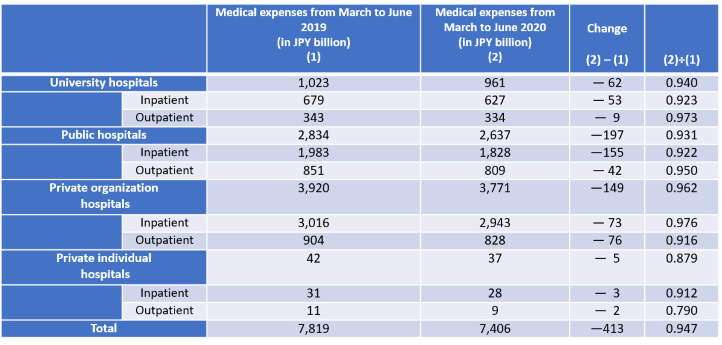
Source: Ministry of Health, Labour and Welfare
Figure 1 Year-on-year comparison of inpatient medical expenses in hospitals from March to June 2020
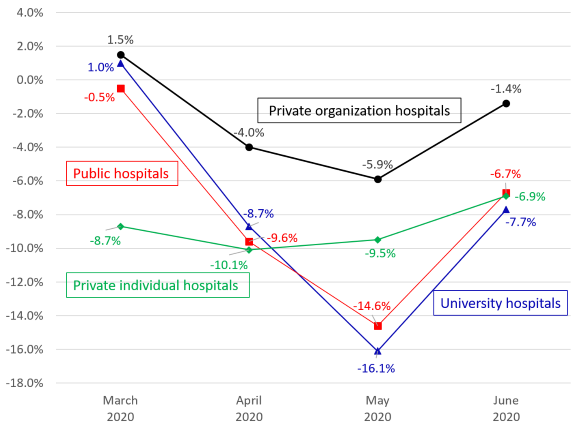
Source: Ministry of Health, Labor, and Welfare
Figure 2 Year-on-year comparison of outpatient medical expenses in hospitals from March to June 2020
Source: Ministry of Health, Labour and Welfare
Figure 3 Year-on-year comparison of medical expenses in clinics from March to June 2020
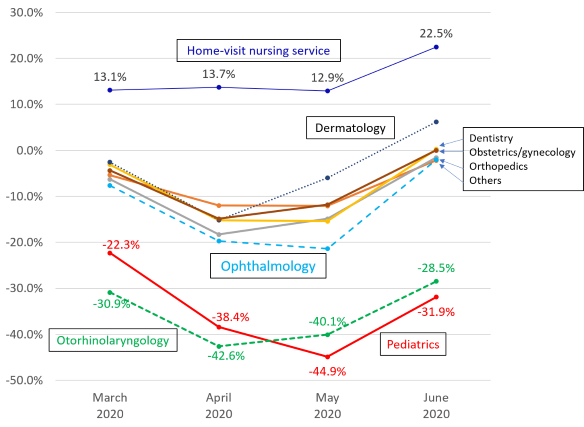
Source: Ministry of Health, Labour and Welfare