Column Finance and the Social Security System 2020.11.09
【Aging, safety net and fiscal crisis in Japan】No.297: Births as a result of infertility treatment accounted for 6.2% of the total number of births in 2018
In this column series, Yukihiro Matsuyama, Research Director at CIGS introduces the latest information about aging, safety net and fiscal crisis in Japan with data of international comparison.

The Suga administration—inaugurated in September 2020—has promised to cover the costs of infertility treatment through public health insurance. As shown in Figure 1, the number of births as a result of infertility treatment increased from 28,945 in 2010 to 56,979 in 2018. During this period, the total number of births decreased from 1,071,305 to 918,400, and the percentage of births based on infertility treatment increased from 2.7% to 6.2%. According to the Ministry of Health, Labour and Welfare, the average cost of infertility treatment is JPY 380,000 (US$ 3,585) for in vitro fertilization and JPY 430,000 (US$ 4,057) for intracytoplasmic sperm injection; however, the patient’s cost burden may exceed JPY 1 million (US$ 9,434). Although there is a support program in which the government subsidizes between JPY 150,000 (US$ 1,415) and JPY 300,000 (US$ 2,830) for patients who meet certain conditions, the cost burden on patients is still heavy.
Figure 2 shows an international comparison of the age structure of patients seeking infertility treatment. A characteristic of infertility treatment in Japan is that the percentage of patients aged 40 years and older is high, at 43.%. As the success rate of infertility treatment decreases with age, it is necessary to reform the system so that even young people can seek treatment. In addition, the disadvantage of making fertility treatments more accessible through public health insurance should not be overlooked, as this pressurizes couples to continue the treatment until they have a child.
Figure 1 Number of births as a result of infertility treatment
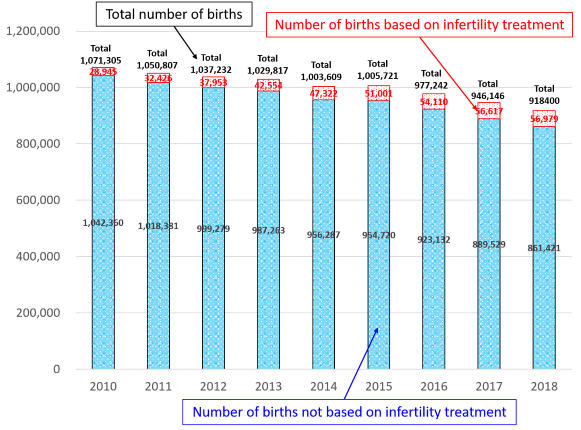
Source: Ministry of Health, Labour and Welfare
Figure 2 International comparison of the age structure of patients seeking infertility treatment.
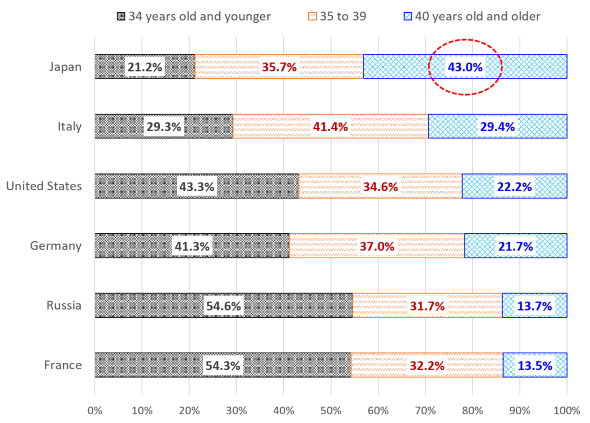
Source: Ministry of Health, Labour and Welfare