Column Finance and the Social Security System 2020.11.06
【Aging, safety net and fiscal crisis in Japan】No.295: The disparity of private company salaries based on gender and contract type
In this column series, Yukihiro Matsuyama, Research Director at CIGS introduces the latest information about aging, safety net and fiscal crisis in Japan with data of international comparison.
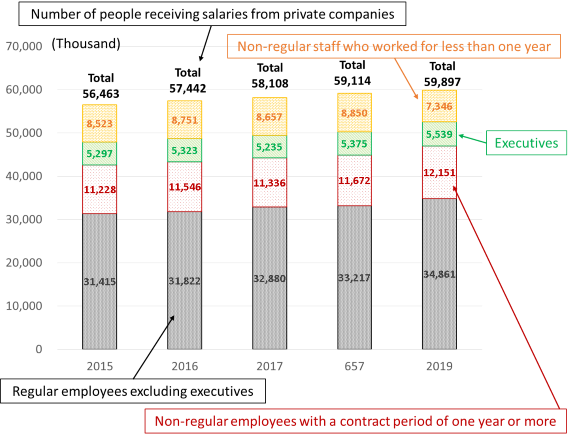
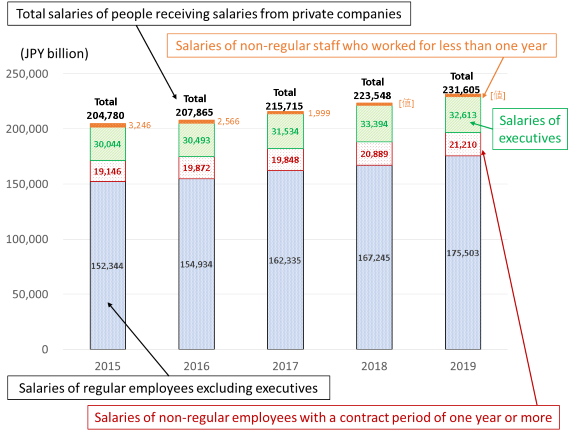
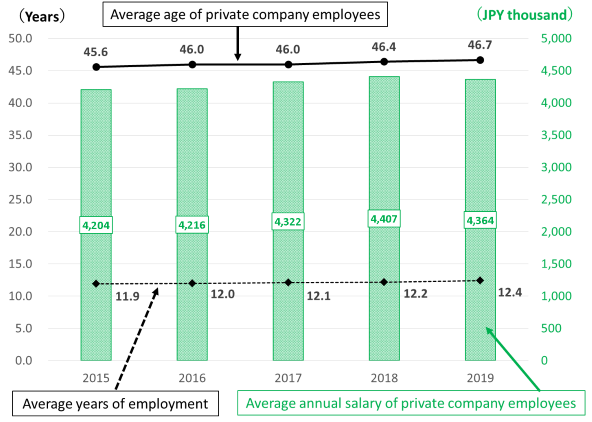
The National Tax Agency publishes annual income and tax statistics for all workers who receive salaries from private companies. The number of workers increased from 56,463,000 in 2015 to 59,897,000 in 2019 (Figure 1). The breakdown was 34,861,000 for regular employees, excluding officers, 12,151,000 for non-regular employees with a contract period of one year or more, 5,539,000 for officers, and 7,346,000 for non-regular staff who worked for less than one year. Figure 2 shows the total salary for each of these groups. The average annual salary of salaried workers, excluding non-regular staff who worked for less than one year, increased from JPY 4,204,000 (US $ 39,660) in 2015 to JPY 4,364,000 (US $ 41,170) in 2019 (Figure 3). This increase reflects a salary level up, as well as increases in average age (from 45.6 to 46.7) and increases in average length of employment (from 11.9. to 12.4 years).
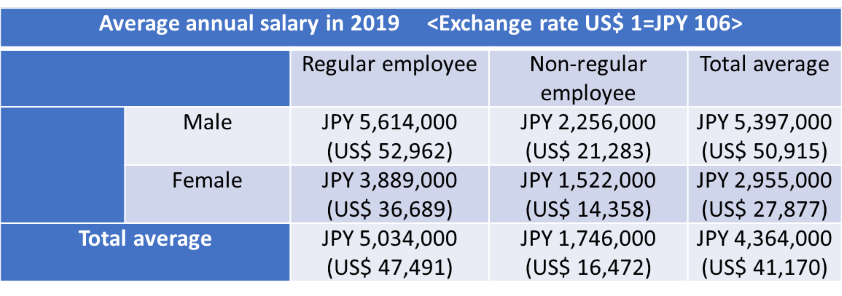
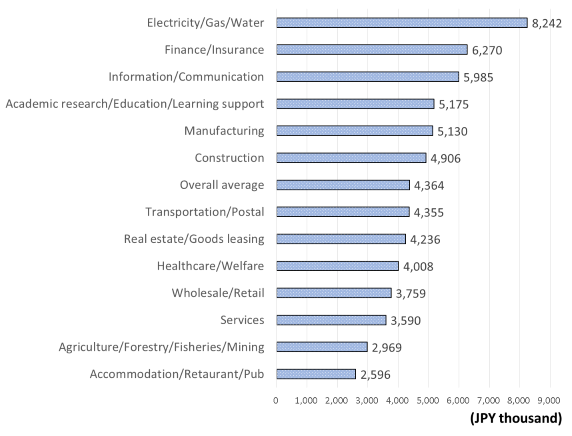
Table 1 shows the disparity in average annual salaries based on gender and type of employment contract. The gap between JPY 2,955,000 (US $ 27,877) for females and JPY 5,397,000 (US $ 50,915) for males, and between JPY 1,746,000 (US $ 16,472) for non-regular employees and JPY 5,034,000 (US $ 47,491) for regular employees is 1.8 times and 2.9 times, respectively. Figure 4 shows the average annual salary by industry. The gap between JPY 2,596,000 (US $ 24,491) for the accommodation/restaurant/pub industry and JPY 8,242,000 (US $ 77,755) for the electricity/gas/water industry is very large, with the latter being 3.2 times higher. Currently, narrowing such disparities is a major political issue.
Figure 1: Number of people receiving salaries from private companies
Source: National Tax Agency
Figure 2: Salaries of people that are employed by private companies
Source: National Tax Agency
Figure 3: Average annual salary of private company employees, excluding non-regular staff who worked for less than one year
Source: National Tax Agency
Table 1: Average annual salary disparity by gender and employment contract
Source: National Tax Agency
Figure 4: Average annual salary of private company employees by industry
Source: National Tax Agency
