Column Finance and the Social Security System 2020.10.15
【Aging, safety net and fiscal crisis in Japan】No.291: Land prices decreased due to the economic stagnation caused by COVID-19
In this column series, Yukihiro Matsuyama, Research Director at CIGS introduces the latest information about aging, safety net and fiscal crisis in Japan with data of international comparison.
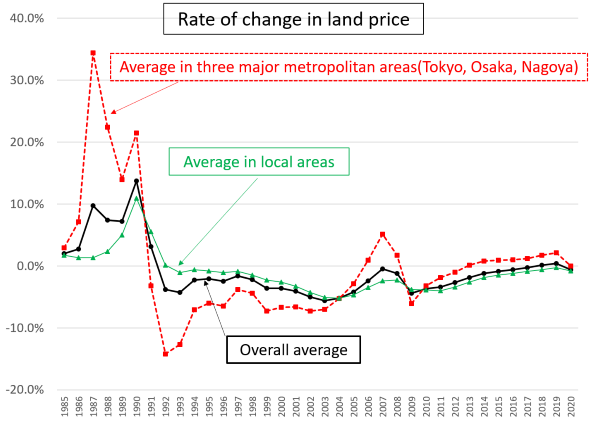
The Ministry of Land, Infrastructure, Transport, and Tourism surveys land prices at about 21,500 points every year and publishes the rate of change in land prices by region and use, such as housing, commercial facilities, and manufacturing facilities. The survey from July 1st, 2020, found that the average national land price change rate was −0.6% in 2020. This is because the rate of increase in land prices in the three major metropolitan areas (Tokyo, Osaka, and Nagoya), which had been rising since 2014, dropped from 2.1% in 2019 to 0% due to the economic stagnation caused by COVID-19, while land prices in local areas also dropped by 0.8%.
Figure 1 shows the rate of change in land prices from 1985 to 2020 in the three major metropolitan areas and local areas. It can be seen that the soaring land prices in the bubble economy that began in 1986 and the plunge in land prices after the collapse of the bubble economy in 1991 mainly occurred in these three major metropolitan areas. The overall average rate of change in land prices was negative from 1992 to 2017, primarily because the rate of change in land prices across local areas has not been positive since 1994.
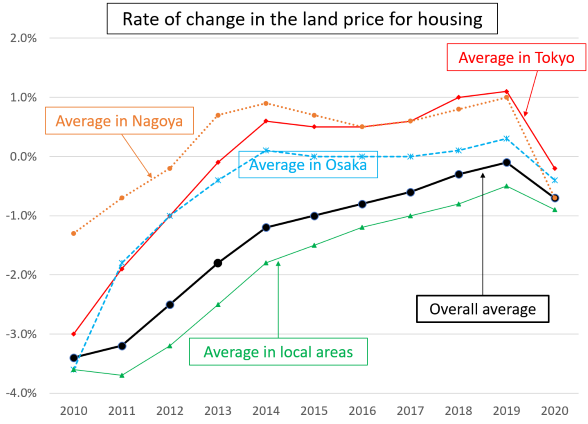
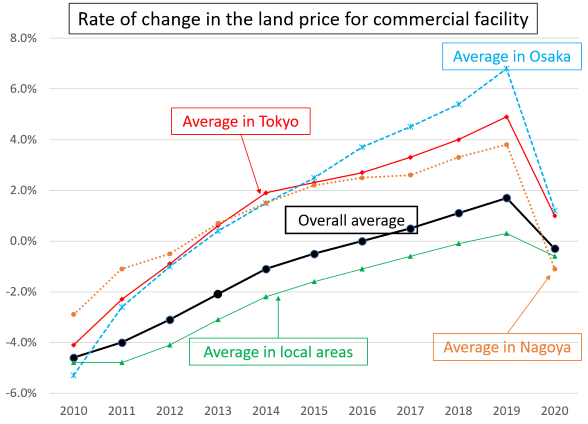
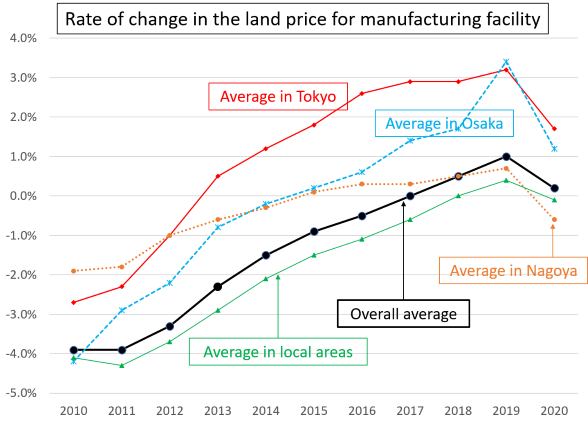
Figures 2, 3, and 4 show the rate of change in regional land prices for housing, residential land, commercial facility land, and manufacturing facility, respectively. The continuous decline in land prices for housing in local areas seems to be largely affected by the declining population. The rate of change in land prices for commercial facilities in the three major metropolitan areas, which had been on an upward trend since 2014, were recorded as +4.9% in Tokyo, +6.8% in Osaka, and +3.8% in Nagoya in 2019. It is noteworthy that land prices for manufacturing facilities in Tokyo began to rise in 2013, and are more in demand than those in Osaka and Nagoya. However, if the end of the COVID-19 crisis is prolonged, this rise will come to an end.
Figure 1 Rate of change in land price

Source: Ministry of Land, Infrastructure, Transport, and Tourism
Figure 2 Rate of change in the land price for housing

Source: Ministry of Land, Infrastructure, Transport, and Tourism
Figure 3 Rate of change in the land price for commercial facilities

Source: Ministry of Land, Infrastructure, Transport, and Tourism
Figure 4 Rate of change in the land price for manufacturing facilities

Source: Ministry of Land, Infrastructure, Transport, and Tourism
