Column Finance and the Social Security System 2020.10.15
【Aging, safety net and fiscal crisis in Japan】No.288: What do the changes in household financial assets and savings rates suggest?
In this column series, Yukihiro Matsuyama, Research Director at CIGS introduces the latest information about aging, safety net and fiscal crisis in Japan with data of international comparison.

According to the Bank of Japan’s statistics on the flow of funds for the second quarter of 2020, household financial assets increased by JPY 55 trillion, from JPY 1,828 trillion in March 2020 to JPY 1,883 trillion in June 2020. The main reasons for this rise are increases in cash and deposits (by JPY 31 trillion) and in stock valuation (by JPY 15 trillion) due to the recovery of stock prices. As a factor of the increase in cash and deposits of JPY 31 trillion, it should be noted that JPY 19 trillion, generated by people restraining from spending money, is larger than the JPY 12 trillion reflecting the benefit distribution of JPY 100,000 per person as an economic measure against the COVID-19 pandemic.
As shown in Figure 2, the rate of household savings fell to −0.3% in 2014 and then recovered to 4.9% in 2019. The reason why people are curbing consumption and increasing their savings seems to be that they are worried about the future, as their disposable income is not increasing. As shown in Figure 3, disposable income did not increase during the period between 1998 and 2019, due to the low growth rate of salaries and the increase in the burden of social insurance premiums. In the first quarter of 2020, when the self-restraint of socio-economic activities to prevent the spread of COVID-19 began, the saving rate jumped to 8.0%. As of October 2020, consumption has risen again due to the government’s subsidy stimulus package to encourage travel and eating out; in order to transition to the new normal economy, it is essential to achieve economic growth and increase disposable income.
Figure 1 Household financial assets
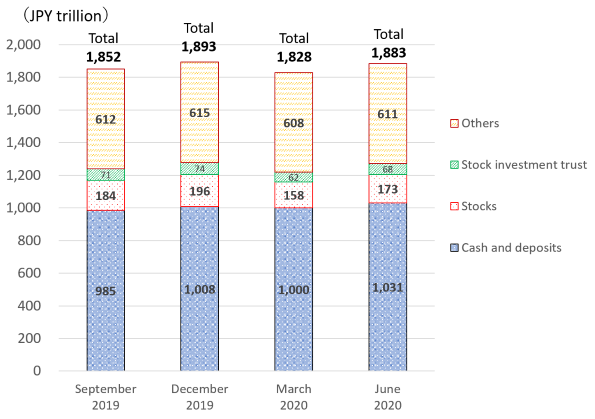
Source: Bank of Japan
Figure 2 Household savings rate
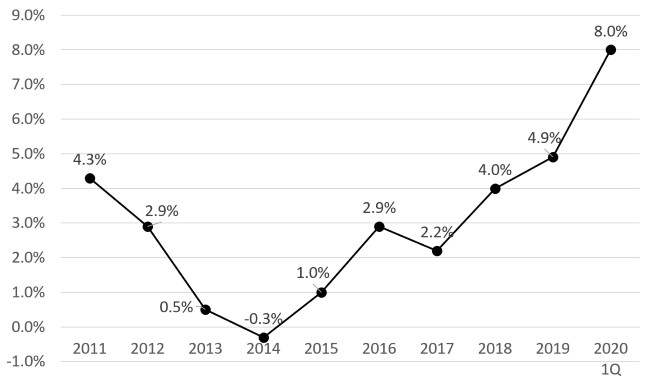
Source: Cabinet Office
Figure 3 Disposable income
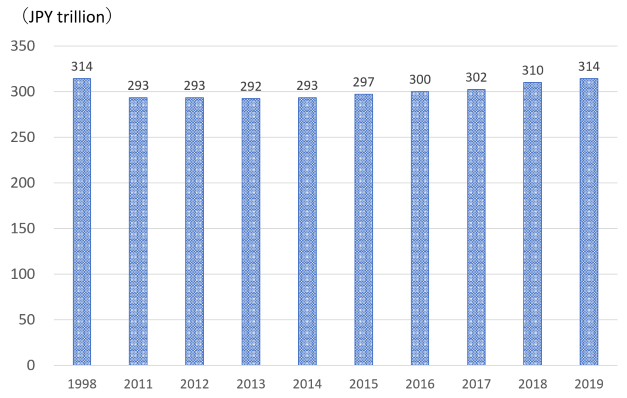
Source: Cabinet Office