Column Finance and the Social Security System 2020.06.25
【Aging, safety net and fiscal crisis in Japan】No.235: Impact of COVID-19 on consumption behavior in households
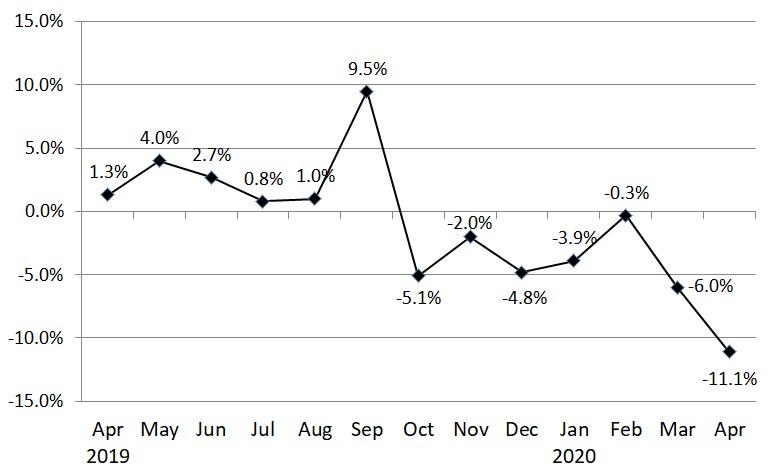
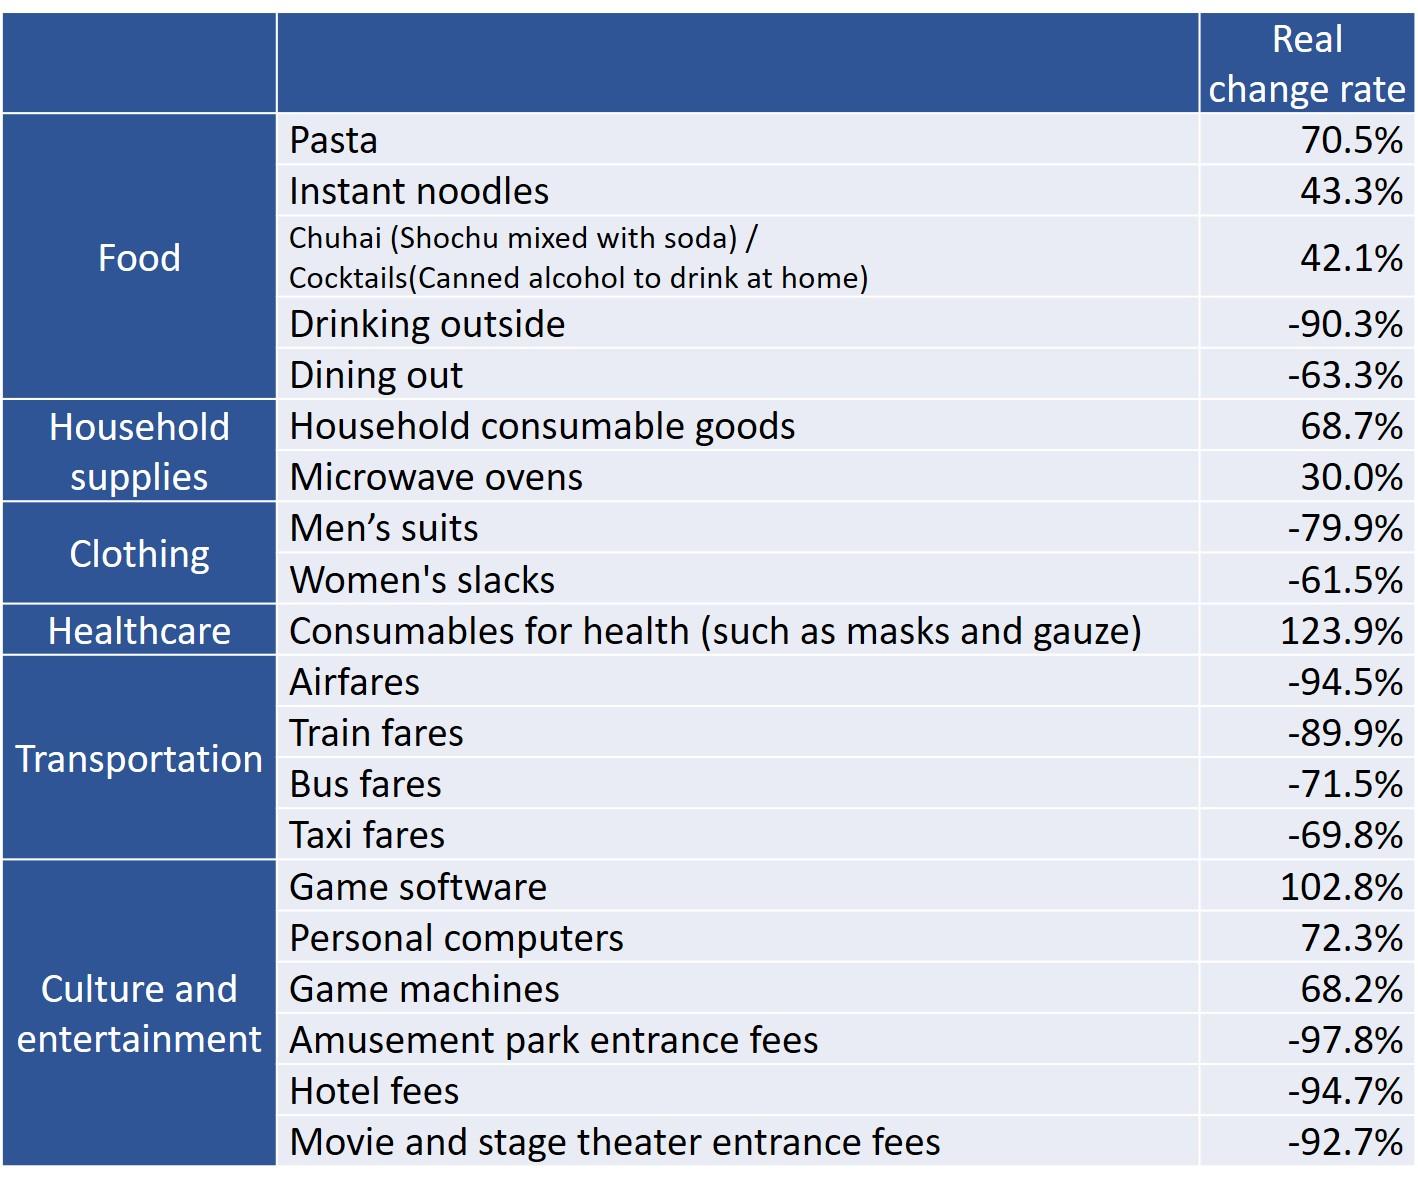
The Ministry of Internal Affairs and Communications has released statistics on consumption expenditure and income in April 2020 for households with two or more people. As shown in Figure 1, consumption expenditure in April 2020 decreased by 11.1% compared to April 2019. This decrease is a result of people refraining from going out to prevent the spread of COVID-19. Table 1 shows the items whose consumption expenditure has changed significantly compared to a year ago. Interestingly, the consumption of items including pasta and instant noodles is increasing. Furthermore, PC sales have increased by 72.3% due to an increase in remote work.
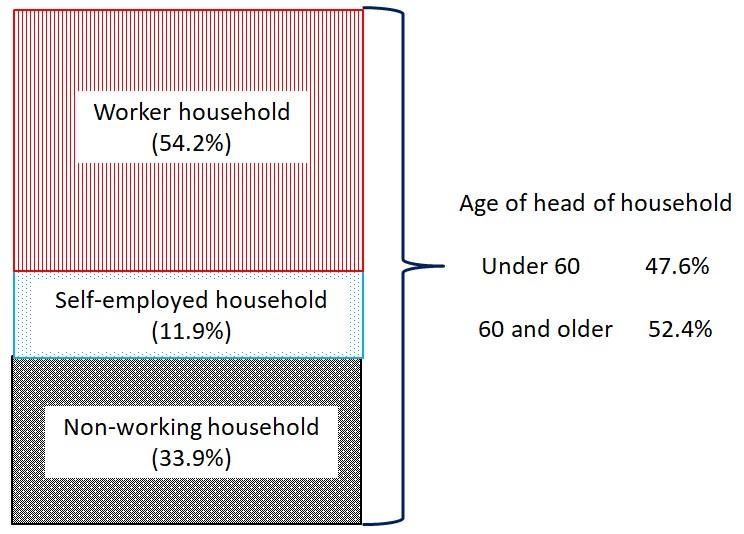
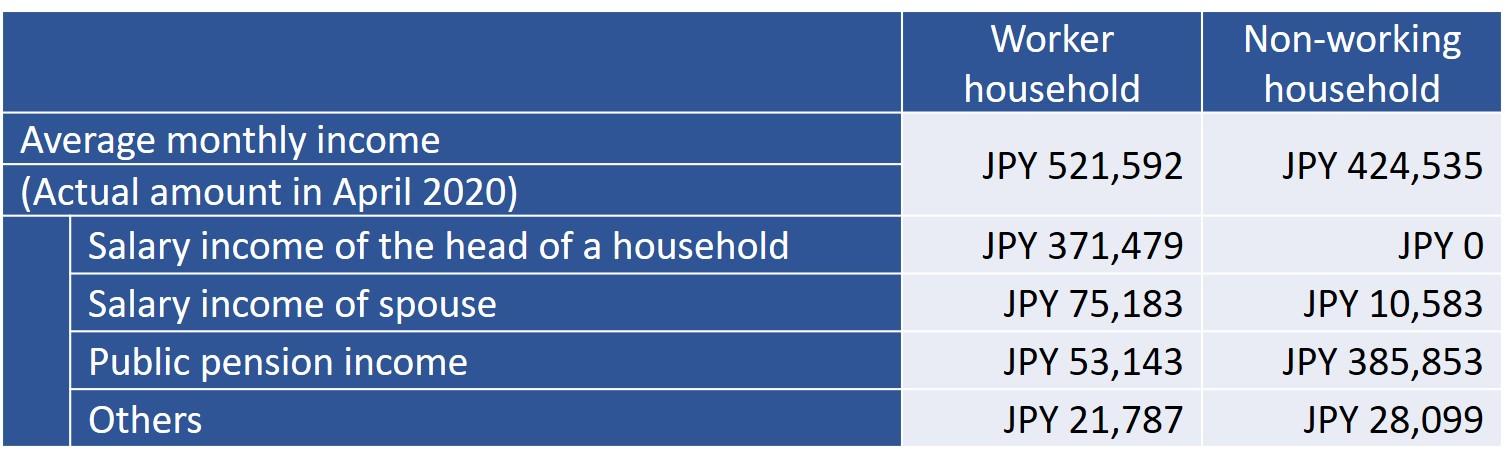
Figure 2 shows a breakdown of households with two or more people that form part of the statistics. Worker households constitute 54.2% , self-employed households constitute 11.9%, and non-working households constitute 33.9%. By comparing the income of Worker households and Non-working households, a surprising discovery was made: the public pension amount for non-working households (JPY 385,853) is larger than the salary income of the heads of worker households (JPY 371,479) (Table 2).
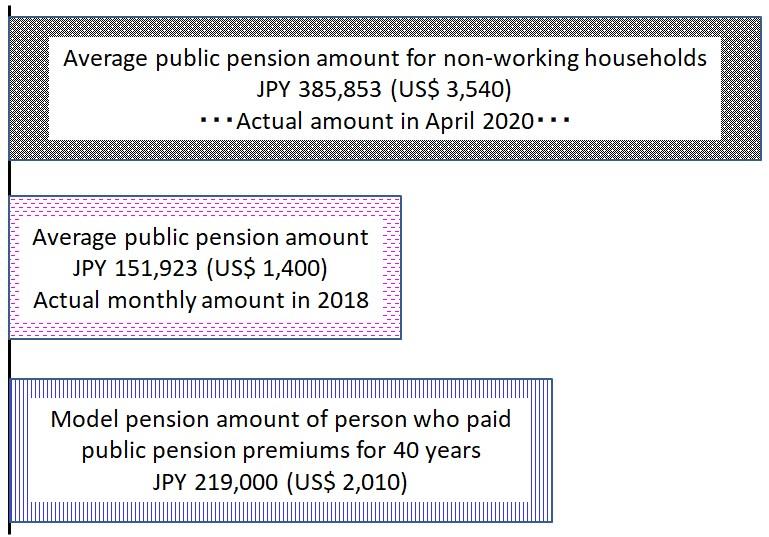
As shown in Figure 3, the average monthly amount of public pension is JPY 151,923 (US$ 1,400). The model pension amount that the government is using to explain the pension system is JPY 219,000 (US$ 2,010). I asked the Ministry of Health, Labor, and Welfare the reason why the public pension amount for non-working households is as high as JPY 385,853 (US$ 3,540). The answer was, "Since both a husband and a wife worked, there are many households in which each person has the right to receive a public pension." As shown in Column No. 229, the average elderly person is wealthy, and the current social security system favors the elderly too much.
Figure 1 Real monthly base of year-on-year change rate in consumer spending
 *Please click the table image to find the original size image.
 Source: Ministry of Internal Affairs and Communications
Table 1 Real base change rate of consumption in April 2020 compared to April 2019
 *Please click the table image to find the original size image.
 Source: Ministry of Internal Affairs and Communications
Figure 2 Breakdown of households that account for two or more people
 *Please click the table image to find the original size image.
 Source: Ministry of Internal Affairs and Communications
Table 2 Income comparison between working and non-working households
 *Please click the table image to find the original size image.
 Source: Ministry of Internal Affairs and Communications
Figure 3 Average public pension amount for non-working households
 *Please click the table image to find the original size image.
 Source: Ministry of Internal Affairs and Communications, Ministry of Health, Labor, and Welfare