Media Global Economy 2020.05.12
The responses of consumption and prices in Japan to the COVID-19 crisis and the Tohoku earthquake
It has only been a month since the coronavirus shock emerged in Japan and its full nature is still unclear. This column compares the responses of consumption and prices to the COVID-19 shock and another large-scale natural disaster that hit Japan, the Tohoku earthquake in March 2011. The responses of supermarket sales and prices at a daily frequency during the two crises are quite similar. However, evidence suggests that whereas people expected higher inflation for goods and services in the wake of the earthquake, they expect lower inflation in response to the coronavirus shock, suggesting that the economic deterioration due to COVID-19 should be viewed as driven mainly by an adverse aggregate demand shock to face-to-face service industries such as hotels and leisure, transportation, and retail, rather than as driven by an aggregate supply shock.
It has only been a month since the coronavirus shock emerged in Japan and its full nature is still unclear. However, various kinds of data are starting shed some light. In this column, I will outline the features that have come into view and will use these as a starting point to consider the future.
Starting with the supply side, since people (=workers) stay at home, they cannot engage in production activities. Of course, some work can be carried out remotely, so that staying at home does not mean that all production activities cease. However, work such as working on a production line in a factory cannot be done remotely since it requires collaboration. Deaths through viral infections mean that the number of workers declines. This happened in the pandemic of a hundred years ago, the Spanish flu, which started in 1918 and ended in 1919. The Spanish flu is thought to have killed 2% of the global population, and deaths were concentrated among those in their prime working years, causing a fall in production.
Turning to the demand side, people (=consumers) staying at home leads to a slowdown in consumption activities. For certain types of services, contact with staff or other customers is inevitable. A typical example is entertainment such as watching sports events or going to the movies. Firms that provide such services are diverse and, in terms of conventional categories, belong to industries such as hotels and leisure, transportation, retail, and so on. I will refer to these services collectively as face-to-face (F2F) industries.
Another channel through which coronavirus infections can affect aggregate demand is the increase in uncertainty. It is known that when people are faced with serious uncertainty and no one knows what the future holds, they assume the worst and then choose the best action based on this assumption (e.g. Nishimura and Ozaki 2017).
In the case of the Spanish flu a hundred years ago, loss of supply capacity also affects wages and prices. According to Barro et al. (2020), the decline in the labour supply due to the pandemic raised prices of goods and services by 20 percentage points at least temporarily. In terms of a recent example for Japan, when the Tohoku earthquake struck in 2011, GDP fell sharply and prices rose. This is another example where the shock to supply was dominant (Watanabe et al. 2015, Carvalho et al. 2016). In contrast, during the 2008 global financial crisis, prices fell along with the decline in GDP in developed countries including Japan. This indicates that the demand shock was dominant. The coronavirus shock is both a supply and a demand shock, but knowing which of these is more salient is a key issue for understanding how the coronavirus affects the economy.
What credit card data tell us about current consumption patterns
To obtain a first tentative sense of the economic impact of the coronavirus pandemic, I use various kinds of data from February onward, when the outbreak started to gather pace in Japan, to examine whether the coronavirus shock is primarily a demand or a supply shock.
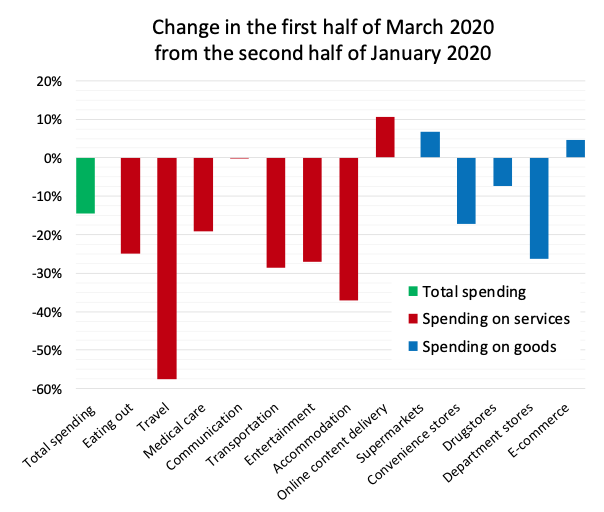
Figure 1 shows how credit card spending in the first half of March differed from the second half of January, just before the coronavirus shock. The red bars show expenditure on services, while the blue bars represent spending on goods. In services, travel spending has fallen substantially by 57% compared to the second half of January, while spending on most other services such as eating out and transportation has also declined. Thus, spending on F2F industries has dropped sharply. An important thing to highlight is that the decline in spending in F2F industries is mainly due to a decline in the number of consumers spending on those services (i.e. the extensive margin) rather than due to a decline in the average of spending on those services per person (i.e. the intensive margin). Turning to spending on goods, on the other hand, spending at supermarkets has increased significantly, reflecting stockpiling.
Figure 1 Credit card purchases

Source: Nowcast Inc., "JCB Consumption NOW."
Stockpiling of goods
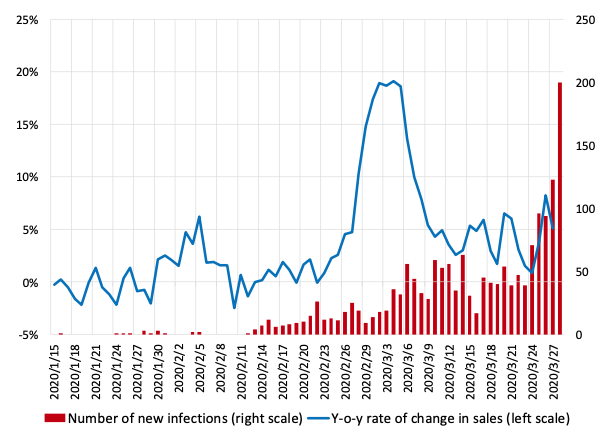
To take a closer look at the stockpiling of goods, Figure 2 shows the year-on-year rate of change in daily sales using scanner data collected from about 1,000 supermarkets. The number of newly infected people began to increase rapidly around 22 February, and a government panel of experts on 24 February stated that the next 1-2 weeks would be critical in terms of whether the outbreak would accelerate or could be brought under control. Purchases at supermarkets surged on 24 February, reaching a year-on-year rate of increase of 20% at the beginning of March. After that, stockpiling came to an end, the rate of change decreased and has fallen back to more or less the same level as before the coronavirus outbreak. However, more recent data indicate that the rate of sales growth began picking up again on 25 March, when Tokyo Governor Yuriko Koike hinted at a lockdown of Tokyo.
Figure 2 The number of new infections in Japan and supermarket sales

Sources: Nowcast Inc., "Nikkei CPINow." NHK News Web.
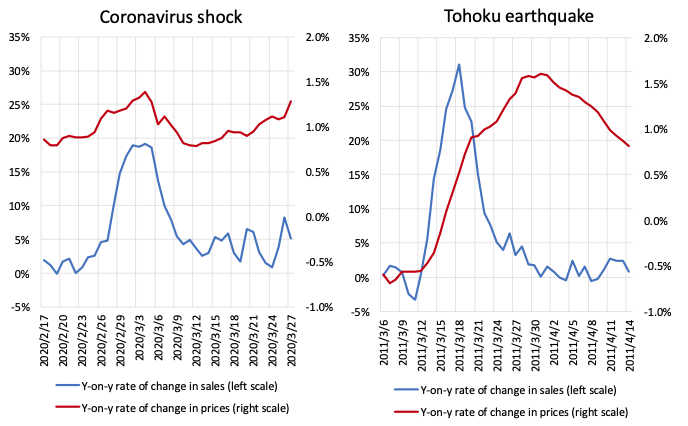
Supermarket prices also started to rise at about the same time as sales (see the left panel of Figure 3). The year-on-year inflation rate was about 0.9% before the coronavirus shock, but as the frequency of bargain sales and discounts decreased, it increased, reaching 1.4% at the beginning of March.
In fact, these developments in supermarket sales and prices are very similar to those in the wake of the Tohoku earthquake. At that time, the outlook was uncertain, including problems at the Fukushima nuclear power plant, and people rushed to stock up. The right-hand panel of Figure 3 shows sales and prices following the earthquake, indicating that both sales and inflation first increased and then decreased in a pattern similar to the current episode. The time it took for sales to normalise was three weeks in the wake of the earthquake, and it looks like the time for sales to normalise this time around is about the same. Moreover, not only are the patterns of fluctuations similar, the items people purchased are also very similar.
Figure 3 Supermarket sales and prices at a daily frequency following the coronavirus shock and Tohoku earthquake

Source: Nowcast Inc., "Nikkei CPINow."
Declining inflation expectations
The reason for the stockpiling is that although the probability may be very low, there is an expectation that the coronavirus will lead to the disruption of production in the future. In this sense, the stockpiling of goods and the accompanying rise in prices suggest that people anticipated a supply shock.
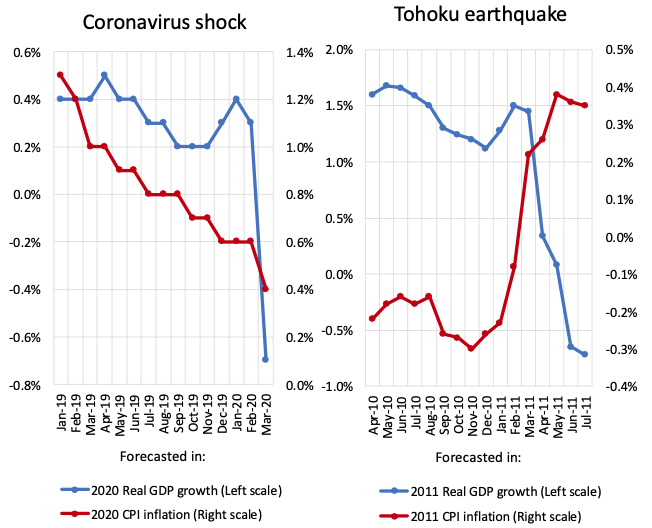
This raises the question whether the spike in goods prices has led to expectations that consumer price inflation in general will pick up due to the coronavirus shock. In order to examine this point, Figure 4 shows how the GDP growth and inflation forecasts of professional forecasters changed over time. Forecasts toward the very right are those made in March and reflect the impact of the coronavirus outbreak on expectations.
Figure 4 GDP growth and inflation forecasts by professional forecasters

Source: Consensus Economics Inc., "Consensus Forecasts."
Forecasts for GDP growth show a significant drop from forecasts in February and signal that negative growth is expected. More importantly, the inflation forecasts are slightly lower than in February 2020. Similar trends can be seen in the US and the euro area. Further, looking at inflation expectations from bond market data (the breakeven inflation rate), these have fallen by more than 1 percentage point, indicating a marked decline in inflation expectations.
The current decline in inflation expectations stands in stark contrast with the time of the Tohoku earthquake. Following the earthquake, as shown in the right panel of Figure 4, GDP growth forecasts also fell sharply, but inflation expectations increased rather than decreased. Since the Tohoku earthquake was a supply shock caused by the destruction of capital stock, supply bottlenecks occurred, and as a result prices were expected to rise. In contrast, during the current crisis, there were concerns about supply bottlenecks for some items, such as cup noodles and toilet paper, as in the wake of the earthquake, but such concerns were limited and did not spread to many other products and services. On the other hand, the sharp decline in demand for F2F industries has pushed down the prices of these services, and the anticipation that this will continue in the future has given rise to expectations that consumer prices as a whole will fall.
Temporary public health damage but permanent economic damage
The Tohoku earthquake destroyed capital stock, and repairing or replacing it took time. The Spanish flu a hundred years ago killed a large number of working-age persons, and this loss of human capital also took time to replace. Thus, since replacing production factors such as capital and labour takes time, supply shocks caused by natural disasters can give rise to a prolonged period of negative or sluggish growth.
In contrast, during the current crisis there are no losses of production factors such as capital and labour, and it is not expected that such losses will occur in the near future. Instead, the main cause of the crisis is the decrease in demand for the F2F industries caused by concerns about the risk of coronavirus infection. Therefore, once such concerns disappear, the decline in demand should disappear, and the F2F industries should rebound. However, the stock market does not seem to anticipate such a V-shaped recovery.
This raises the question how a transient public health crisis can lead to a prolonged economic crisis. In Watanabe (2020), I present two possible scenarios. The first is one in which the health crisis triggered by coronavirus infections develops into a financial crisis. In the F2F industries, there are many firms experiencing a deterioration in business, and some of them may actually go bankrupt in the near future. Financial institutions may be affected as loans to such firm become irrecoverable.
The second is that demand might not return to the F2F industries once the pandemic has ended. At least part of the F2F industries were exposed to a wave of technological innovation before the coronavirus shock occurred and were headed for a decline. The credit card data show that expenditure on cinemas and theatres has been declining in recent years, and instead expenditure on online content delivery services has been on the increase. The coronavirus shock could finish off such industries and firms.
References
Nishimura, K G and H Ozaki (2017), Economics of Pessimism and Optimism, Springe
Barro, R, J F Ursua, and J Weng (2020), "The Coronavirus and the Great Influenza Epidemic: Lessons from the 'Spanish Flu' for the Coronavirus's Potential Effects on Mortality and Economic Activity," AEI Economics Working Paper 2020-02.
Watanabe, T, I Uesugi, and A Ono (eds), The Economics of Interfirm Networks, Springer.
Carvalho, V, M Nirei, A Tahbaz-Salehi, and Y Saito (2016), "Supply Chain Disruptions: Evidence from the Great East Japan Earthquake," CEPR Discussion Paper No. 11711.
Watanabe, T (2020), "The Responses of Consumption and Prices in Japan to the COVID-19 Crisis and the Tohoku Earthquake," Working Paper Series, CARF-F-476.
