Column Finance and the Social Security System 2020.04.02
A Coronavirus Pandemic Alert: Massive Testing for COVID-19 in a Large Population Entails Extensive Errors

Introduction
In order to address worldwide concerns about the coronavirus (COVID-19) pandemic, WHO provides the latest situation updates and the relevant data every day with the number of confirmed cases, confirmed deaths, countries, areas or territories with cases and so on [1] .
According to the WHO definition, a confirmed case means a person with laboratory confirmation of COVID-19 infection, irrespective of clinical signs and symptoms. As a PCR test is only available for the coronavirus so far, the confirmed case can be regarded as a person with the PCR test positive for COVID-19.
The number of cases with test positive does not necessarily imply the number of persons who truly get infected, because any test results are subject to false positives and false negatives. The PCR test would work for confirmation of diagnosis at the level of an individual patient highly suspected of COVID-19 infection due to high accuracy of the RNA testing of the virus. Massive testing including persons with no or slight symptoms, however, entails the more extensive errors as the larger the number of target population becomes.
Estimate of False Negatives and False Positives
For example, assumed that the prevalence of COVID-19 is 10% of the target population and the test sensitivity of 70%, the specificity of 99% (set a lower numerical value of the sensitivity than specificity due to some concerns about the risk of false negative [2] ), then if 10 millions of persons are tested, it is likely to result in 390,000 errors (300,000 false negatives, 90,000 false positives), while testing 1000 persons does only 39 errors (30 false negatives, 9 false positives) shown at Table 1.
Table 1. The Number of Errors in COVID-19 Testing
Assumed sensitivity 70% and specificity 99%, by prevalence 10%, 50%, and 90%, and also by cases tested 1, 1000, and 10000000 (persons). *Please click the table image to find the original size image.
 To be more complicated, those errors depend on the prevalence of disease. Table 1 shows detailed estimates for a hypothetical example of the number of errors calculated in different combinations of prevalence and the number of persons tested. According to those estimates, when the prevalence goes up from 10 to 50%, the false negatives also increase from 300,000 to 1,500,000 among 10,000,000 persons. This example gives a lesson that brute-force testing for a large population in which COVID-19 infection is less likely, or even fifty-fifty suspected, overlooks a huge number of infected persons, and it cannot be an effective measure to contain the virus spreading.
Methods for Estimating the Number of Infected Cases
Returning to the WHO statistics in the COVID-19 Situation Report on the web, a fundamental question arises how we could know the number of cases who truly get infected and potential errors behind the statistics reported by WHO.
To find a solution for this question, consider the frame of two-by-two contingency table for a test result: 'positive' or 'negative' and an infection: 'exist' or 'not exist.' Then let T(+) (or T(-)) be the number of cases with test positive(or negative) and D(+) (or D(-) ) be the number of cases who truly get(or do not get) infected. The total number of cases tested is noted as N (i.e., N = T(+) + T(-)), and the sensitivity and specificity of the test as Sn and Sp, respectively.
In those notations, we can make the following equations to satisfy the consistency of two-by-two table, regarding D(+) and D(-) as two unknown variables:
① Sn・D(+) + (1 - Sp)・D(-) = T(+),② (1 - Sn)・D(+) + Sp・D(-) = T(-).
This system of equations ① and ② can be mathematically solved, leading to the following solution:
D(+) = (N・Sp - N + T(+)) / (Sn + Sp - 1),D(-) = (N・Sn - T(+)) / (Sn + Sp - 1).
This solution for D(+) and D(-) means that the number of truly infected and not-infected cases can be estimated, given Sn, Sp, N, and T(+).
Once D(+) and D(-) is estimated, the prevalence of the infection is obtained by the estimate of D(+) divided by the total number, N, of cases tested. Also, the key numbers in four categories of two-by-two contingency table are estimated as follows:
True positives: TP = Sn・D(+) = Sn・(N・Sp - N + T(+)) / (Sn + Sp - 1),
False positives: FP = (1 - Sp)・D(-) = (1 - Sp)・(N・Sn - T(+)) / (Sn + Sp - 1),
False negatives: FN = (1 - Sn)・D(+) = (1 - Sn)・(N・Sp - N + T(+)) / (Sn + Sp - 1),
True negatives: TN = Sp・D(-) = Sp・(N・Sn - T(+)) / (Sn + Sp - 1).
In addition, two conditional probabilities: positive predictive value, PPV, and negative predictive value, NPV, can be estimated as follows:
PPV = TP/T(+) = Sn・(N・Sp - N + T(+) / ((Sn + Sp - 1)・T(+)),
NPV = TN/T(-) = Sp・(N・Sn - T(+)) / ((Sn + Sp - 1)・(N - T(+))).
International Comparison by Country
Then, let us apply the formulae to practical situation of COVID-19 testing in the world. To perform the calculation, considering uncertainty of test accuracy, we assume a range of the sensitivity Sn = (0.7 as the worst, 0.90 as the best) and as well the specificity Sp = (0.99, 0.999) on an empirical basis since no scientific evidence has been established yet for COVID-19 testing.
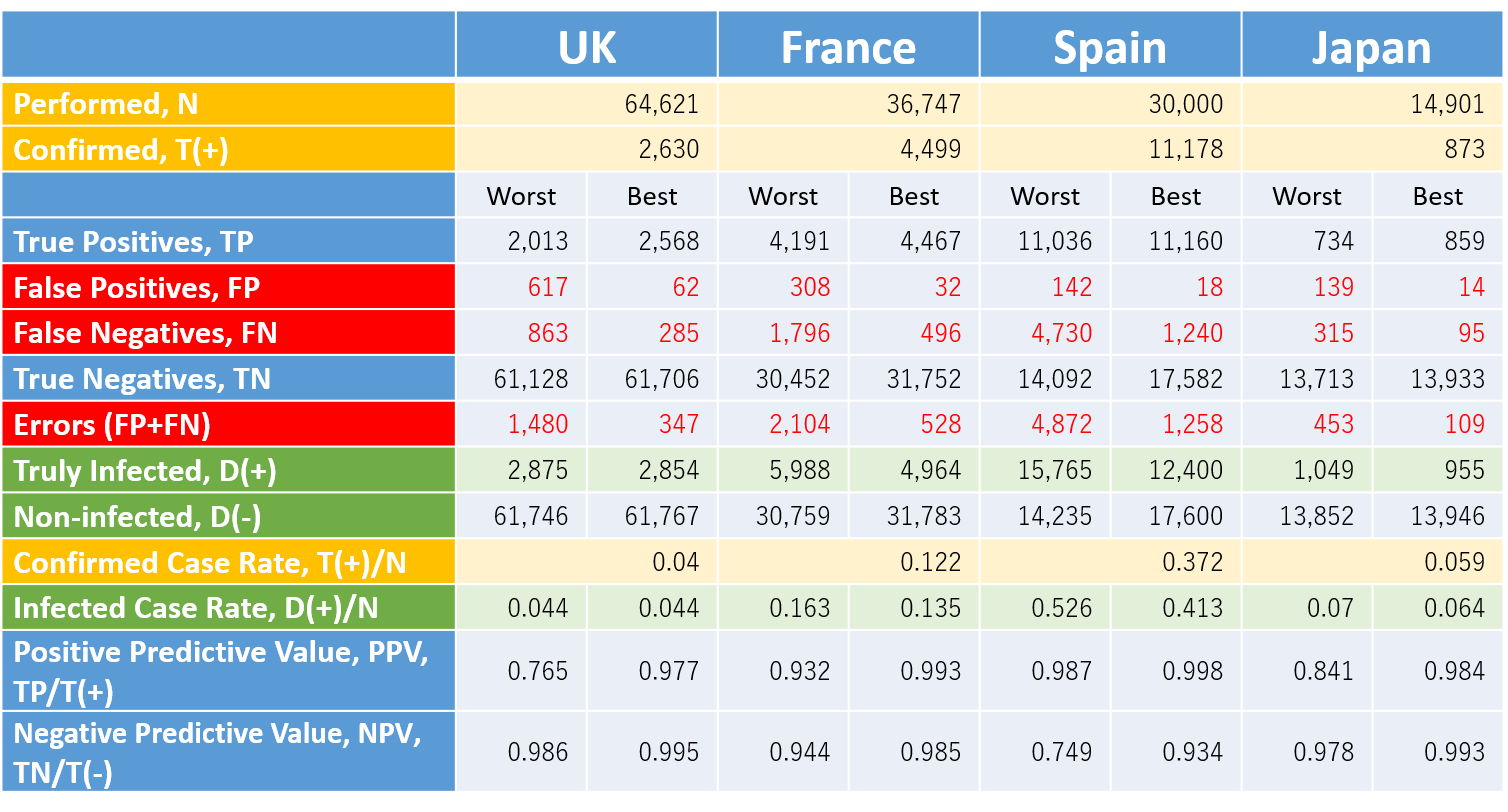
The "Our World In Data" provides a database on the web which includes the statistics of tests conducted vs. confirmed for COVID-19 by country [3] . We can employ the conducted and confirmed cases available in the database for the numerical values to plug in N and T(+) of the formulae. Table 2 indicates the results of calculation for some countries in the world.
Table 2. Estimation of Prevalence, Errors and Relevant Parameters for COVID-19 Testing
N and T(+): quotes from statistics dated on March 20, 2020, "Our World In Data" [3]. The first and second column by country indicates the estimates in the case of the sensitivity and specificity of (0.70, 0.99) as the worst scinario and (0.90, 0.999) as the best one for COVID-19 testing.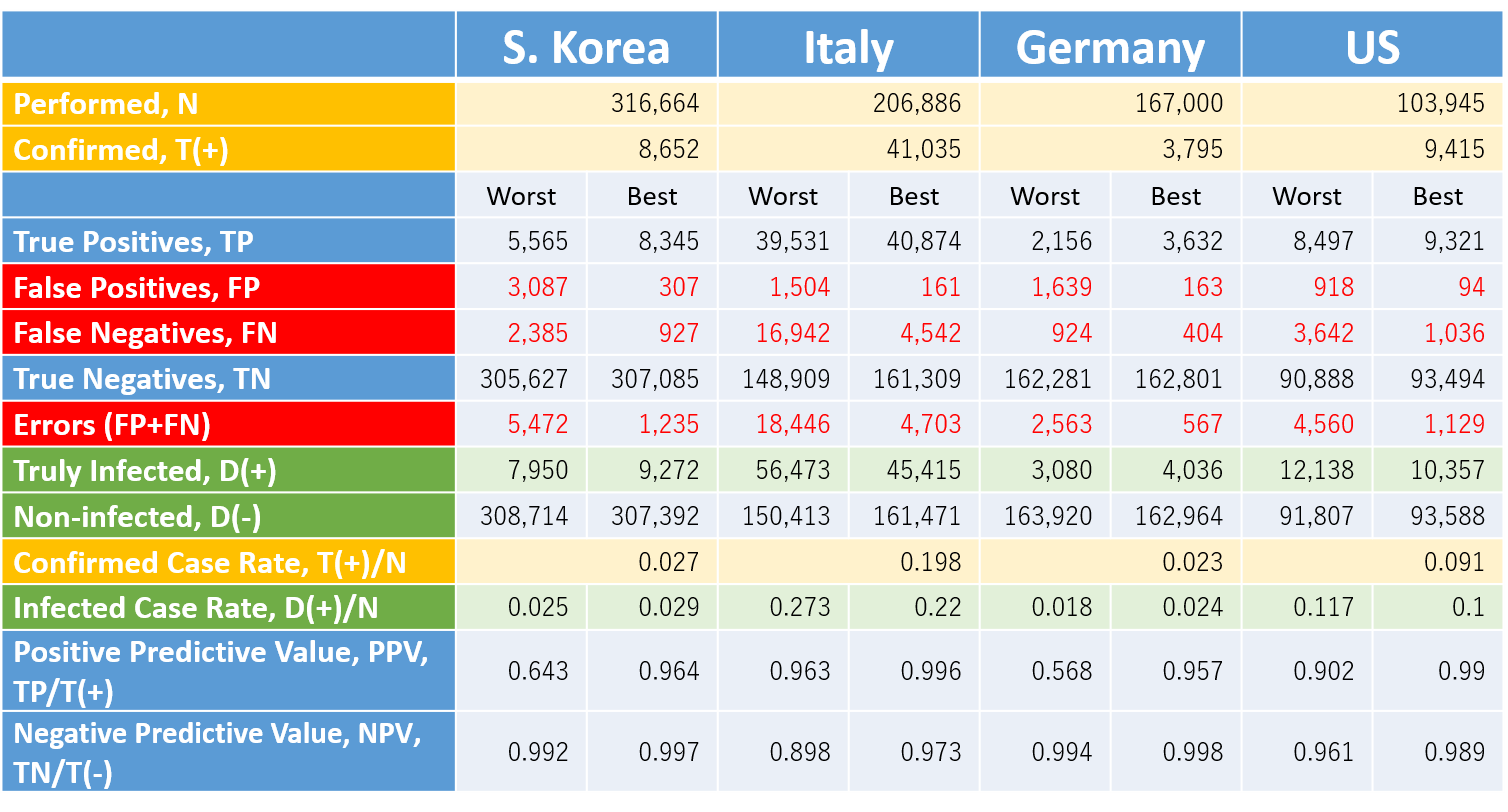
 *Please click the table image to find the original size image.
 It shows the confirmed cases in any country obviously include a considerable number of false positives and failed to include the false negatives. The persons with false negative escaped from an isolation policy and already might spread or even today be spreading the virus in the community, whilst a potential number of false positives might receive unnecessary medical care, staying in bed in a hospital.
Estimate of Fatality by Infected Cases: An Example in Japan
The fatal risk of COVID-19 would be better estimated by dividing the number of confirmed deaths by infected cases, D(+) , not by confirmed cases, T(+). In Table 2, the estimate for D(+) tends to be larger than the number of T(+). In those countries, the fatality risk of COVID-19 is erroneously overestimated by employing T(+) instead of D(+) .
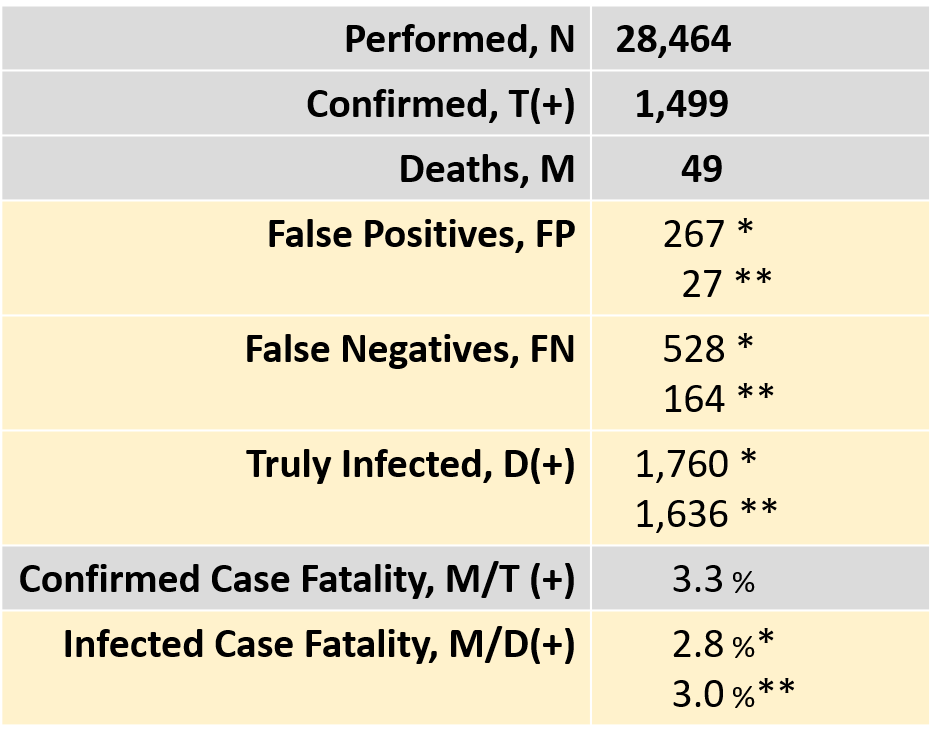
Table 3 indicates an example in Japan. The Ministry of Health, Labour, and Welfare reported 28,464 cases tested, 1,499 confirmed positives, and 49 deaths as of March 28, 12:00PM. The nominal estimate of fatality by positive cases is 3.3% (=49/1,499), but the adjusted estimate of fatality by infected cases goes down to 2.8% with the test sensitivity of 70% and specificity of 99%, or 3.0% with the sensitivity of 90% and specificity of 99.9% since the truly infected cases of 1,760 (or 1,630) is greater than the confirmed cases of 1,499.
Table 3. Adjusted Fatality Considering Test Errors in Japan
N, T(+), and M: quotes from statistics by the Japanese Ministry of Health, Labour, and Welfare on March 28, 12:00 PM(*) Estimates in the case of the sensitivity of 70% and specificity of 99%
(**) Estimates in the case of the sensitivity of 90% and specificity of 99.9%
 *Please click the table image to find the original size image.
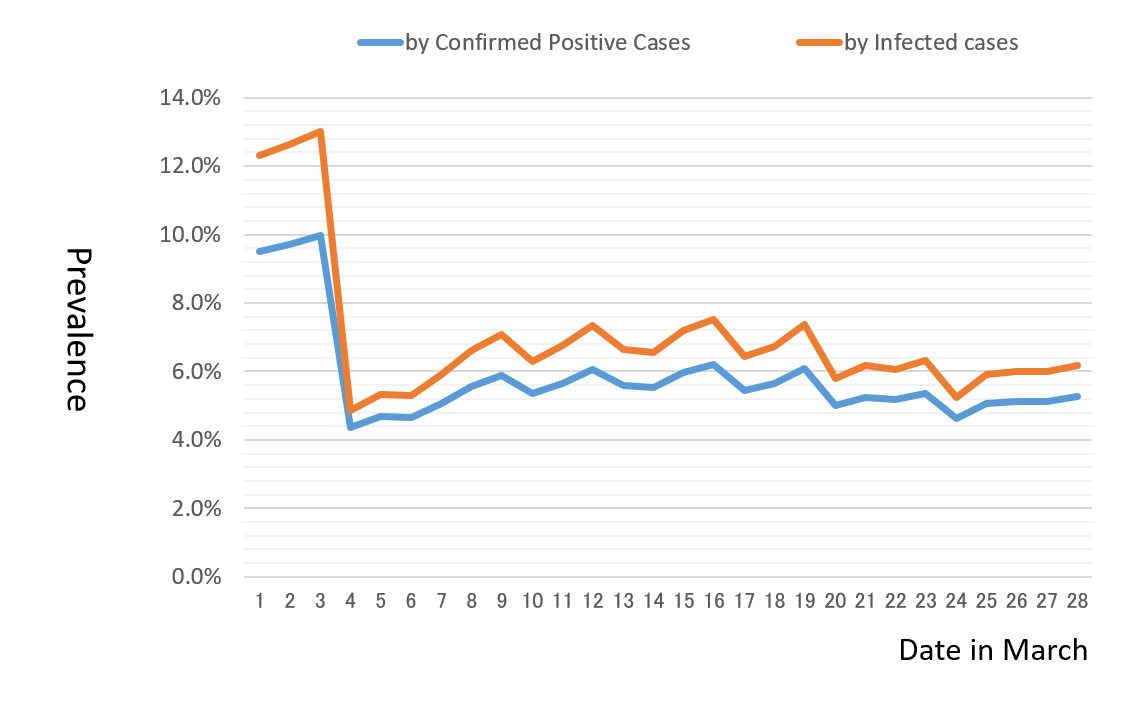
The prevalence estimated over time provides useful information to evaluate the trend of COVID-19 spreading in a community. Figure 1 indicates the trend of the change of daily prevalence from March 1 until March 28. It is estimated in two ways: plugging in a numerator, the number of infected cases, D(+) , or confirmed positive cases, T(+) divided by the total cases tested, N as the denominator. As a result, we observe two curves estimated are moving relative to one another around the rate level of 6.0% except the instability due to inappropriate management of reporting system in early March.
 *Please click the table image to find the original size image.
 Figure 1. Estimates of Prevalence by Day in Japan
1)Calculation based on the statistics, Japanese Ministry of Health, Labour, and Welfare on March 28, 12:00 PM
2)Estimates in the case of the sensitivity of 70% and specificity of 99%
Figure 1 suggests the spread of COVID-19 in Japan has been driven by a constant risk of prevalence with 6.0% those three weeks. It implies it would be possible to model the prediction of infected cases with a constant hazard using an exponential growth: Infected cases = A*exp(0.06*t) + B (where t: time). This formula is determined as 348*exp(0.06*(date in March)) - 109 according to the number of infected cases of 361 on March 5 and 1,760 on March 28. If this assumption of the constant risk of 6% prevalence is maintained, then the number of infected cases in Japan is projected to go up to about 4,000 cases in two weeks and attain to more than 10,000 cases in a month at the end of April.
Concluding Remarks
Massive tests performed for a large population including many people with no symptoms or low risk of COVID-19 drive a considerable number of people tested positive to hospitals without knowing false positive, just fearfully seeking medical care. As a result, the epidemic may overtake the physical and human capacity of the health system in a country. Hospitals are forced to take rationing care for high-risk elderly patients who are severely ill with the virus. Such a hard circumstance in hospitals would bring serious dysfunction of medical response and failure to control the COVID-19 epidemic, which would result in more people infected in the community and more tests in need. Then more tests lead to more errors in testing. Such a negative spiral would be, so to say, "massive testing trap" as seen in Wuhan, China or in hard-hit Iran, Italy or Spain. The US and some other European countries seem to be confronted with a similar crisis.
The numbers estimated in Table 1 are not exact prediction of test errors since the calculation is provisional at a certain level of test accuracy. However, there are several suggestions on developing test strategies and reporting statistics:
Often the media reports confirmed cases as identical to infected cases. However, confirmed cases do not literally mean infected cases due to test errors such as false positive and false negative.
The number of infected cases can be estimated in theory, given the total number of tests conducted, the number of confirmed cases, and test accuracy with the sensitivity and specificity.
Massive testing of COVID-19 for large, but low-risk population of 10 million is not recommended due to not only no efficacy of prevention caused by one hundred thousands of false negatives, but also nearly one million of false positives that potentially would break down the medical care in which the resources are limited in any country.
Considering the massive testing trap, a strategy to conduct a mass testing is not recommended as the test accuracy might turn down and consequently the errors increase. There are concerns that easy implementation of "drive-through" or "walk-in" testing for prevention purpose in communities is questioned about its quality management on test accuracy. So a slogan, "PCR Test of COVID-19 for all" is wrong and misleading.
As shown in Table 2, any country should carefully evaluate the statistics on COVID-19 testing in own country and clarify the test errors. To conduct this risk evaluation, we need more reliable evidence of the test sensitivity and specificity.
If the number of errors is to be estimated, the prevalence and fatality risk of COVID-19 infection can be better estimated, adjusted by the number of truly infected persons.
The estimates of prevalence over time provides useful information to evaluate the trend of COVID-19 spreading in a community.
Regarding COVID-19 testing, the decision makers in public policy should carefully consider the lessons learned from Table 1 to 3, and also Figure 1, and avoid falling into a pitfall of massive testing trap. It is recommended to develop evidence-based strategies for testing focused on people highly suspected of COVID-19 with high risk factors.
References
[1] WHO: Coronavirus disease (COVID-2019) situation reports
https://www.who.int/emergencies/diseases/novel-coronavirus-2019/situation-reports/
[2] "Our World In Data": Why might COVID-19 tests fail? The tests are not perfect: sometimes, people who have the disease will be wrongly told that they do not, Testing for COVID-19, Coronavirus Disease (COVID-19) - Statistics and Research.
https://ourworldindata.org/coronavirus
[3] "Our World In Data": Tests conducted vs. Total confirmed cases of COVID-19.
https://ourworldindata.org/grapher/tests-vs-confirmed-cases-covid-19
PDF version can be downloaded from here↓