Column Finance and the Social Security System 2020.02.01
【Aging, safety net and fiscal crisis in Japan】No.216: Distribution of profit margins of general clinics and dental clinics

In Column No. 215, I explained the distribution of profit margins of medical corporations that operate general hospitals and psychiatric hospitals. This column summarizes the financial data on medical corporations that operate general clinics and dental clinics. Although the average profit margins of general clinics and dental clinics in 2017 were 4.0% and 3.6%, respectively, a significant structural feature can be observed. Calculating the average profit rates by dividing the period of registration of medical corporations into four parts, it is found that the profit rate of newer medical corporations is remarkably high (Figure 1 and 2).
One of the reasons why older medical corporations have lower profit margins is because they have used up their accumulated profits to pay for doctors' salaries. Out of all the medical corporations that operate general clinics, 24% have a net asset ratio of more than 90% of total assets. The tax rate would be very high if these accumulated profits were combined with temporary income at the time of permanent shut down of the clinic. Therefore, they save money by deliberately discarding their accumulated profits each year before retiring. Some medical corporations have not yet been deregistered after retirement. Such medical corporations have zero income, but continue to record salaries as expenses.
The Medical Law prohibits medical corporations from paying dividends from profits. Hence, medical corporations claim to be not-for-profit establishments. However, such a law seems ineffective because the accumulated profits can be freely converted into the owner's income.
Figure 1 Distribution of profit margins of medical corporations operating general clinics
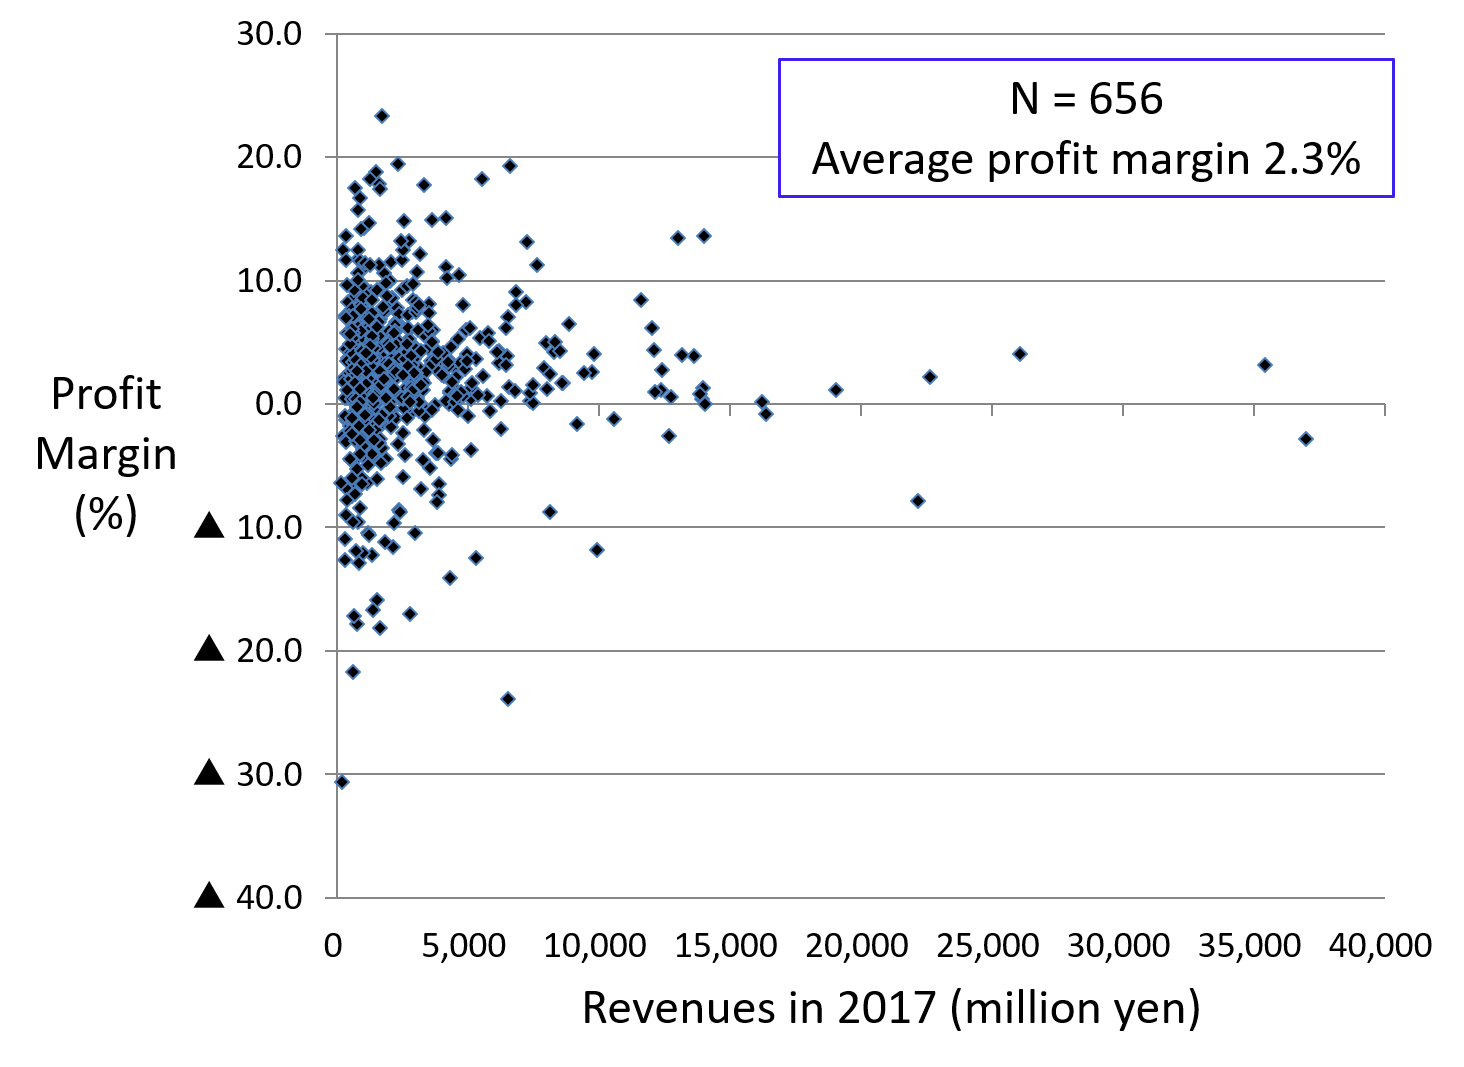
(Source) Financial statements of medical corporations provided by seven prefectures
Figure 2 Distribution of profit margins of medical corporations operating dental clinics
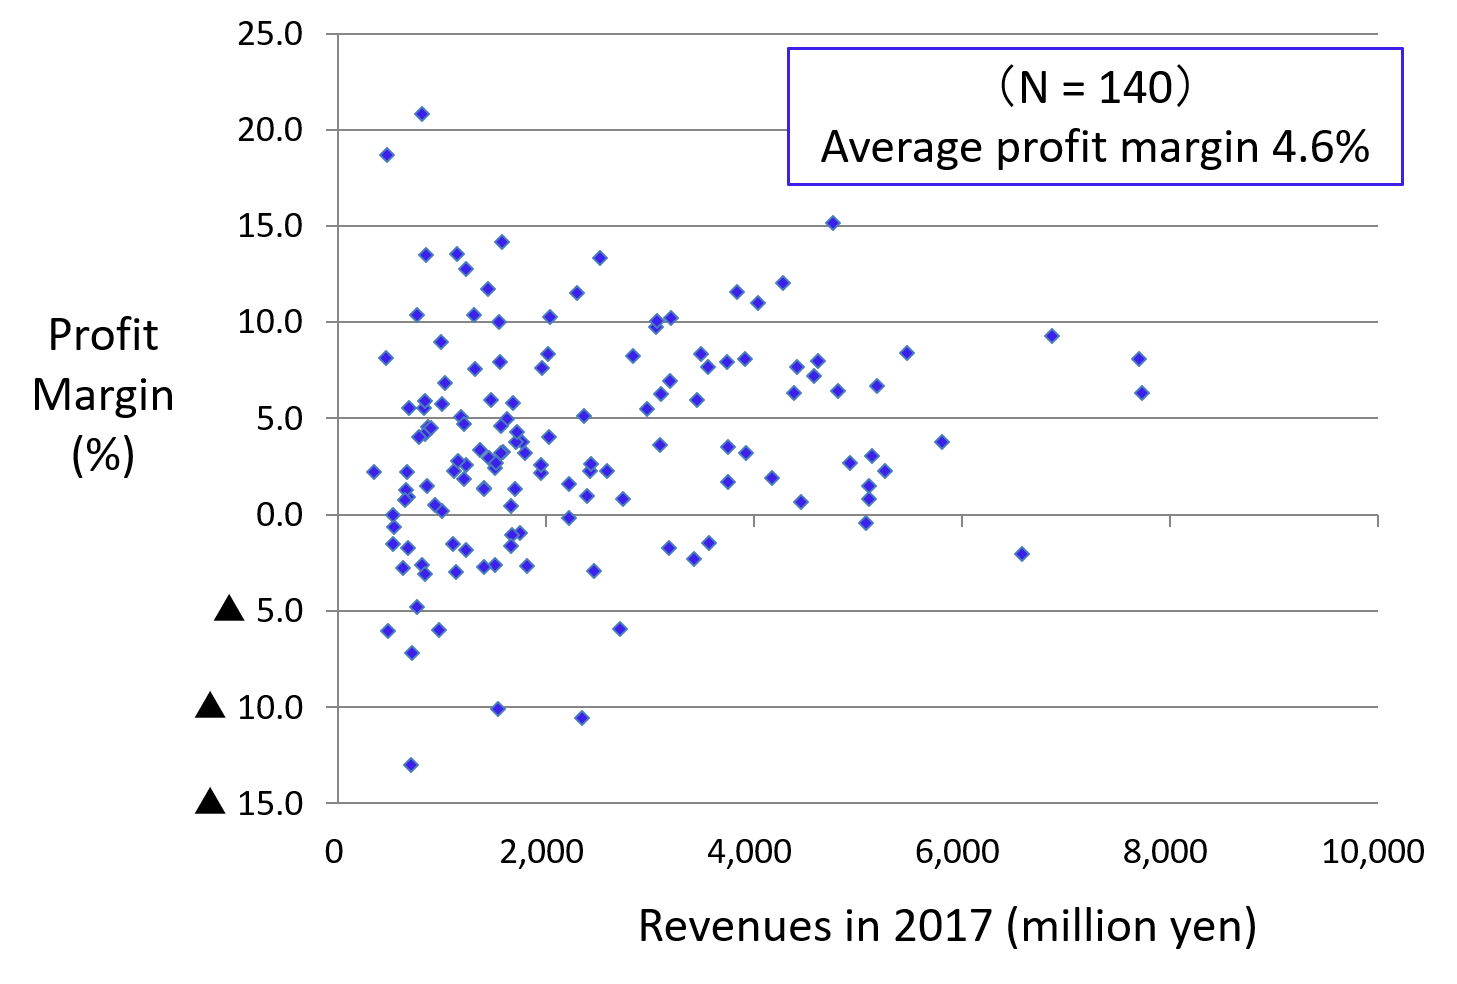
(Source) Financial statements of medical corporations provided by seven prefectures