Column Finance and the Social Security System 2019.07.17
【Aging, safety net and fiscal crisis in Japan】No.203:Lifetime medical expenses per capita according to gender

In January 2019, the Ministry of Health, Labour and Welfare released a report detailing lifetime medical expenses per capita and the average medical expenses according to age group. These figures were based on national medical expense data from 2016. Here, lifetime medical expenses per capita are defined as the average number of medical expenses that an individual requires over their lifetime (assuming that national medical expenses per capita and mortality rates according to age group do not change). Figures do not include long-term care expenses.
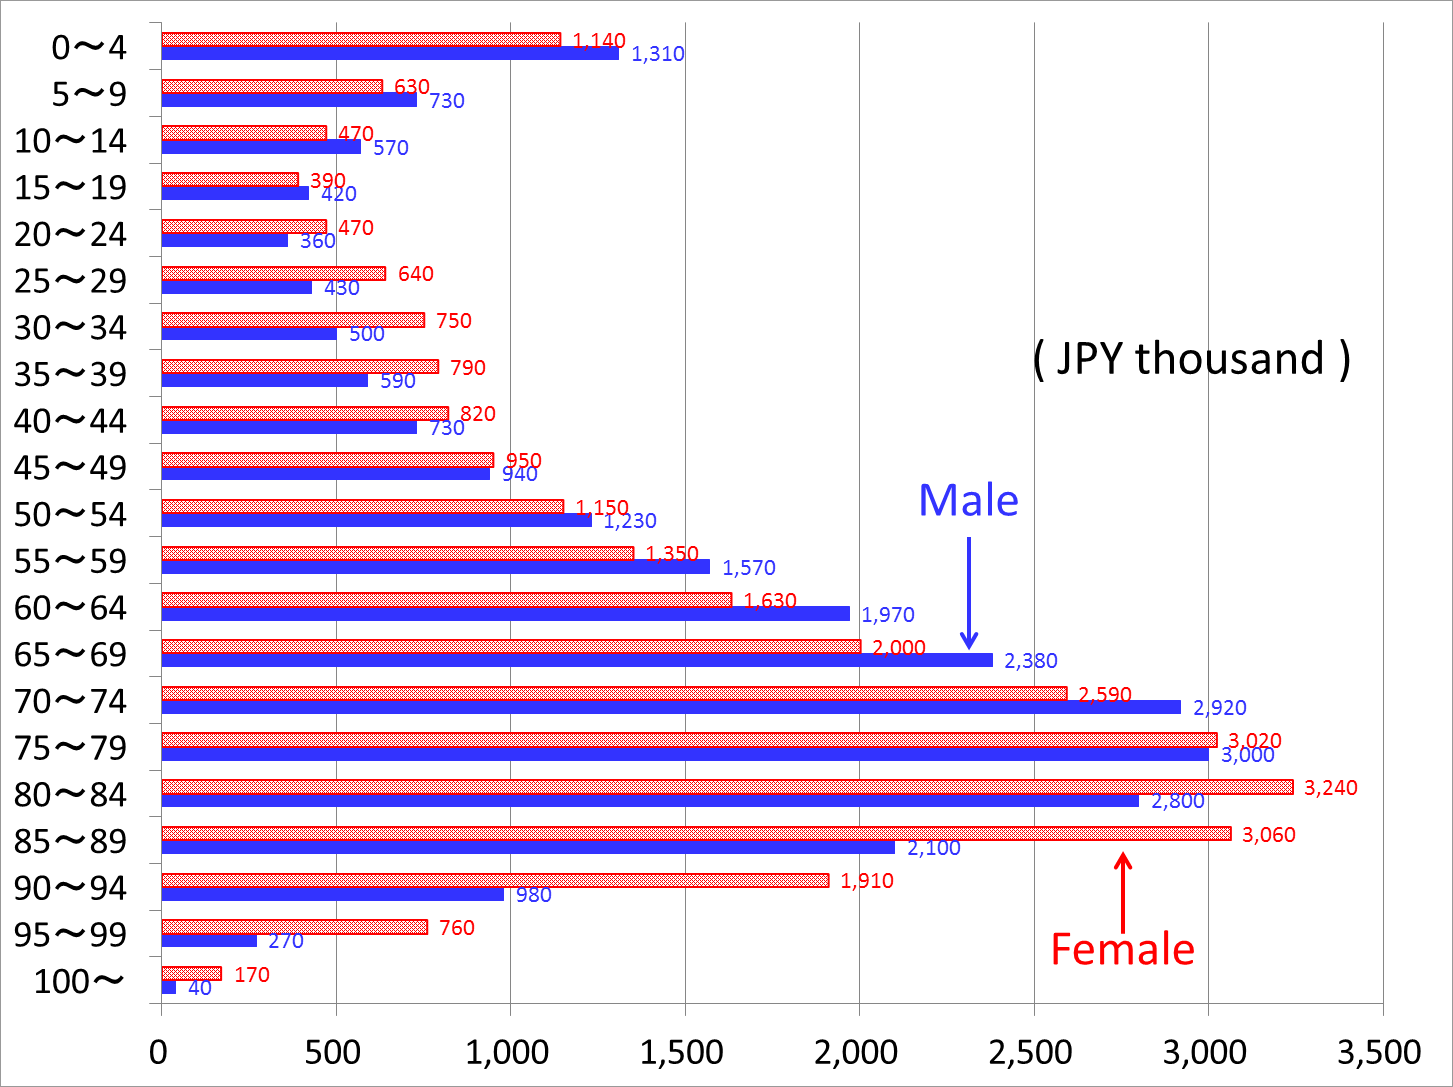
Figure 1 shows the average number of medical expenses per capita according to age group. Notably, these amounts are much higher for males aged 60 to 74 than for females in the same age group. However, there are no difference for those aged 75 to 79. After age 80, the amounts for females are much higher than for males. These numbers may be affected by different life expectancy (i.e., 81.09 years for males and 87.26 years for females). In other words, males tend to incur illnesses (e.g., cancer) at earlier times and thus have higher medical expenses at younger ages.
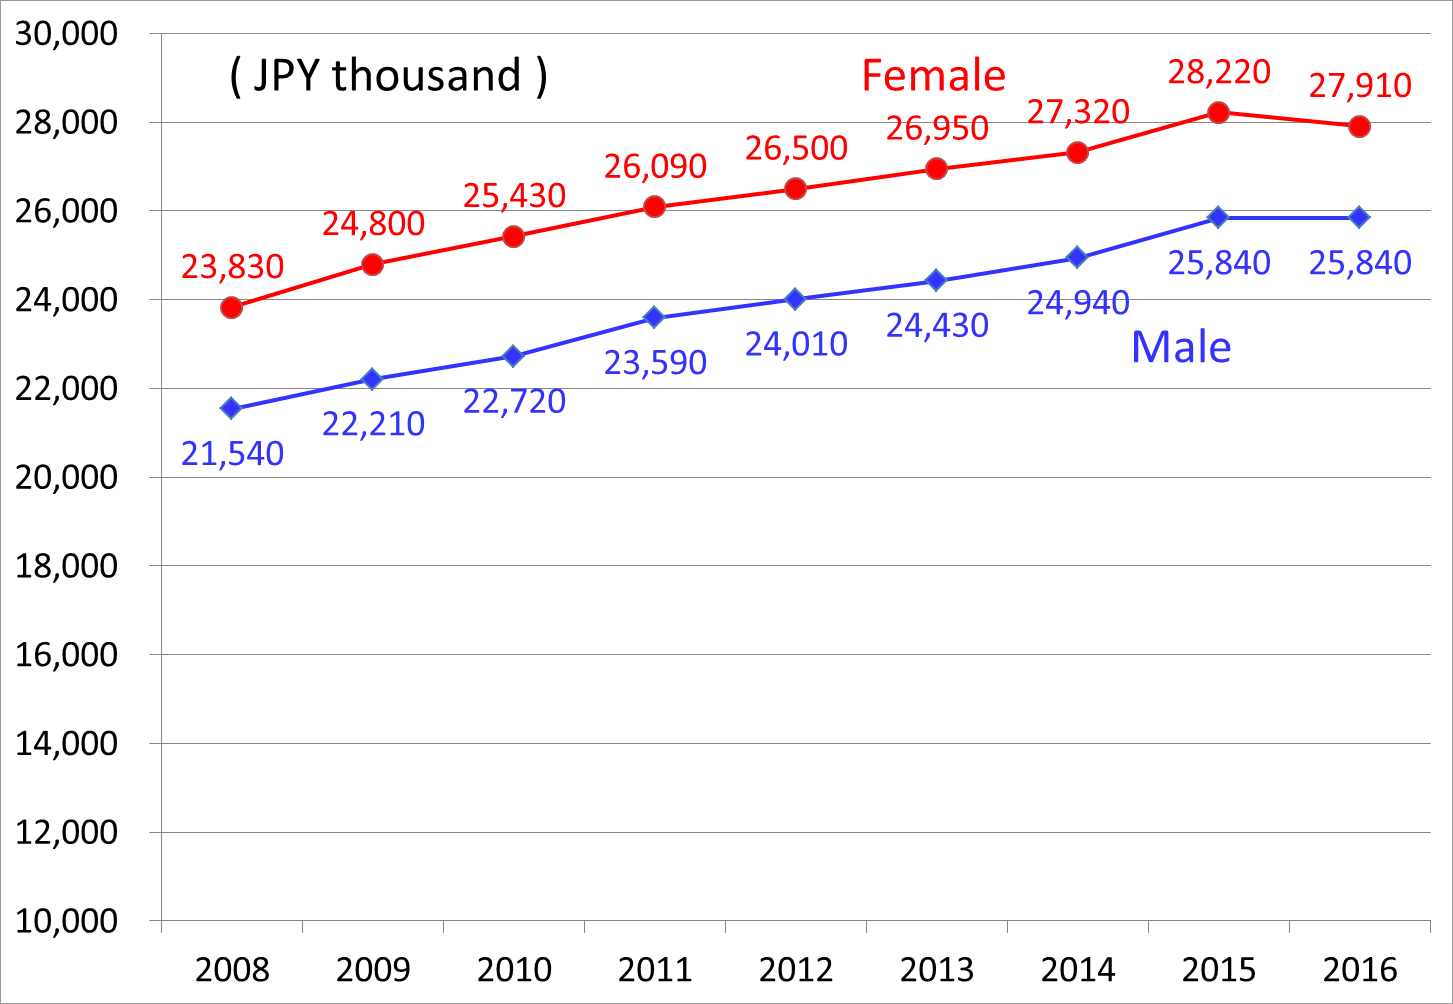
Figure 2 shows the historical trends for lifetime medical expenses per capita according to gender. As shown in Column No. 2 and 122, national medical expenses are increasing as the number of elderly people increases. In addition, the need for new expensive medicines and medical devices becomes more common. As such, lifetime medical expenses per capita are also increasing. The amount for females is JPY 27,910,000, which is larger than the JPY 25,840,000 for males. This can also be explained by different life expectancy.