Column Finance and the Social Security System 2019.02.21
【Aging, safety net and fiscal crisis in Japan】No.162: Malnutrition problem in the elderly

When I took my 89-year-old mother to the hospital last year, I was upset to hear that she was malnourished. Fortunately, by ingesting nutritional supplements on a daily basis, she has increased her body weight and recovered her physical condition.
The Ministry of Health, Labour and Welfare conducts an annual survey on the nutritional status of the people. The survey defines malnutrition as a "BMI of less than 20 kg/m2." BMI stands for Body Mass Index, which represents one's degree of obesity. It is calculated by dividing body weight (kg) by squared height (meters). Figure 1 shows the percentage of malnutrition in people aged 65 or older by gender. In both males and females, it has hardly changed over time. However, as shown in Figure 2, the percentage for people aged 80 years or older is relatively high.
Another problem in the nutrition of people aged 80 years or older is that their meat intake is low. Most of the elderly believe that ingesting calcium through eating fish is effective at preventing osteoporosis. However, bone is not newly formed unless they ingest not only calcium but also zinc. Zinc is contained in meats other than fish. Figure 3 shows some survey results on which foods people ingest to obtain protein. The percentage of people in their 30s, 40s, and 50s getting zinc from meat is 26.8%, 26.6%, and 23.1%, respectively. In contrast, the percentage for those aged 80 years or older is 15.4%.
Figure 1: Percentage of malnourished people among those aged 65 years or older
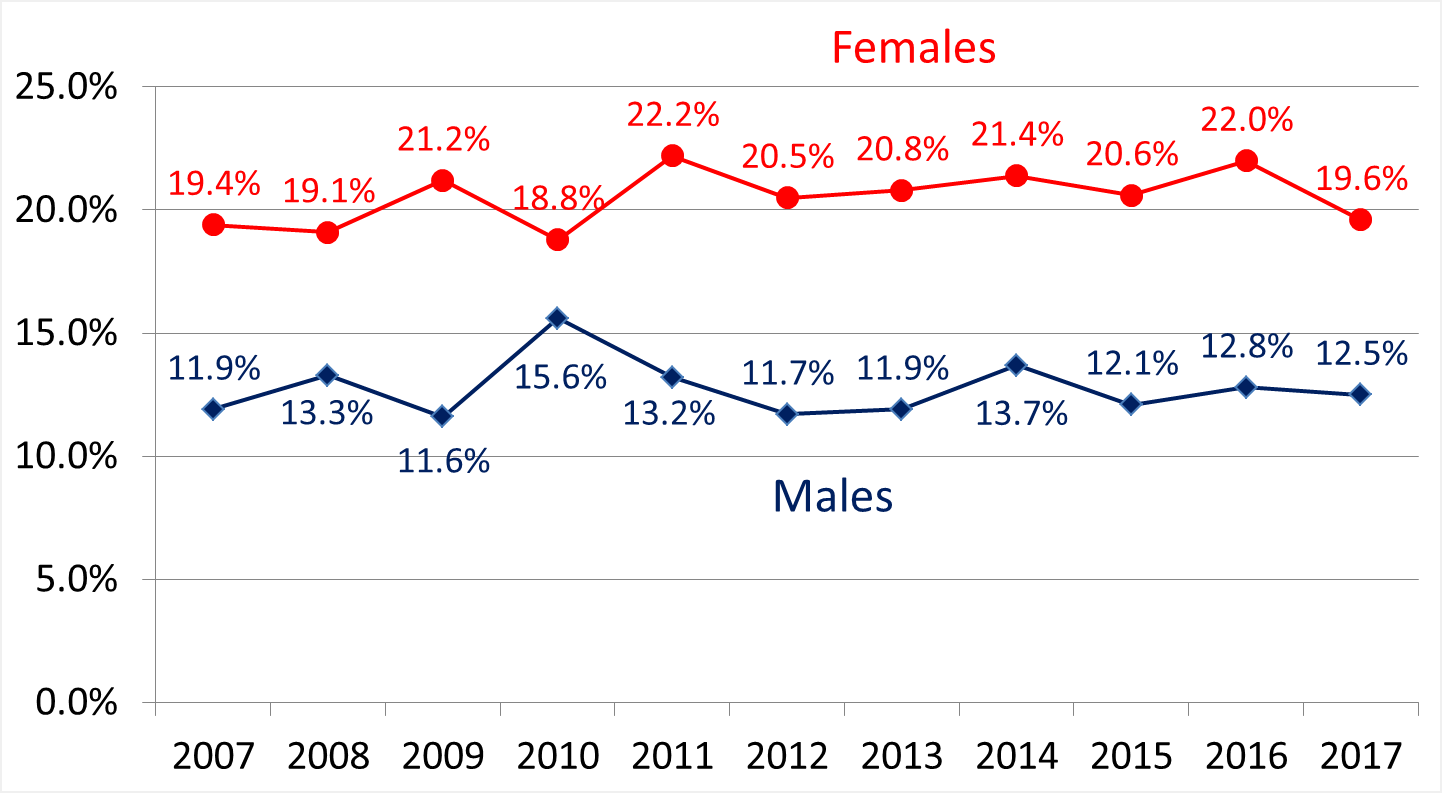
Source: Ministry of Health, Labour and Welfare
Figure 2: Percentage of malnourished people among those aged 65 years or older and 80 years or older in 2017
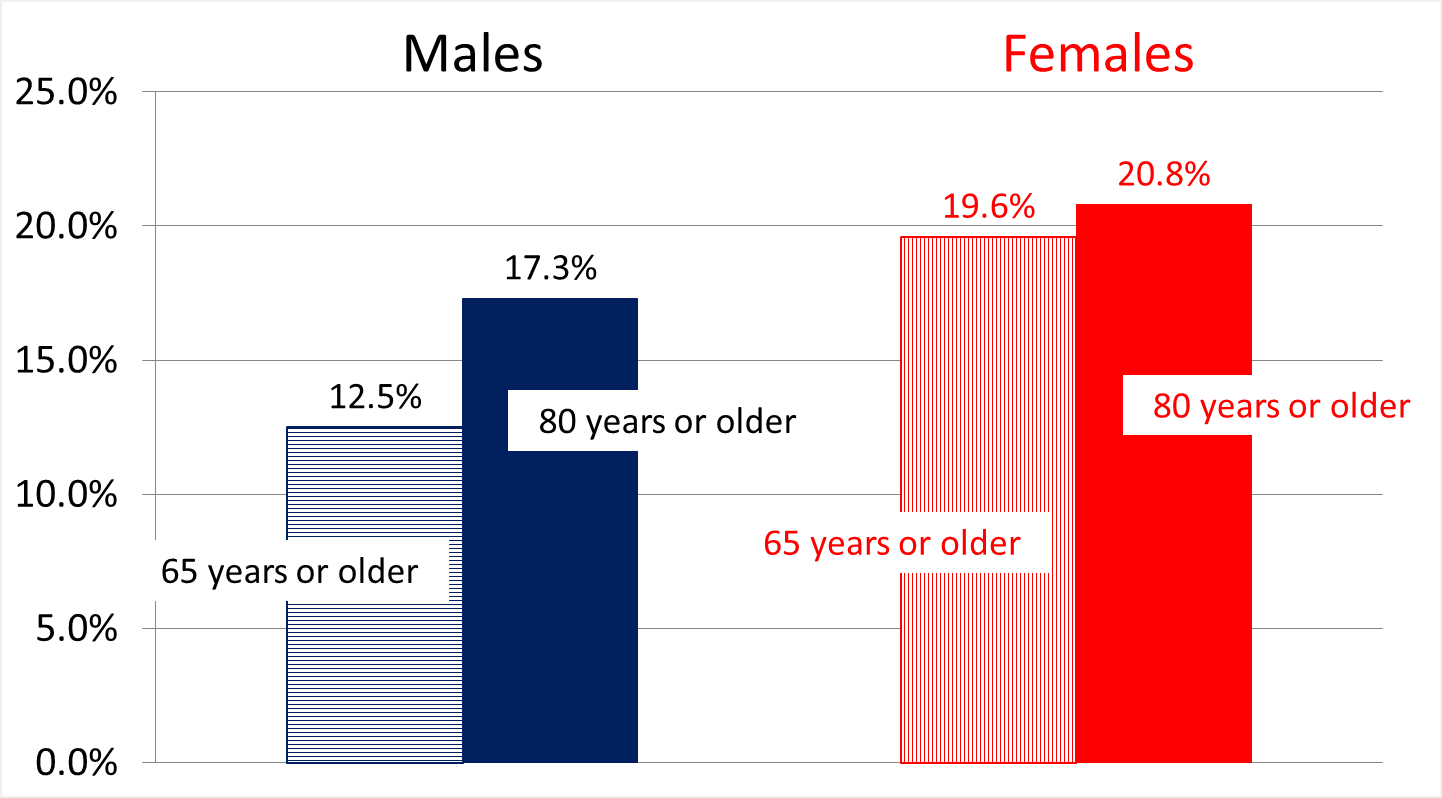
Source: Ministry of Health, Labour and Welfare
Figure 3: Protein intake by age group
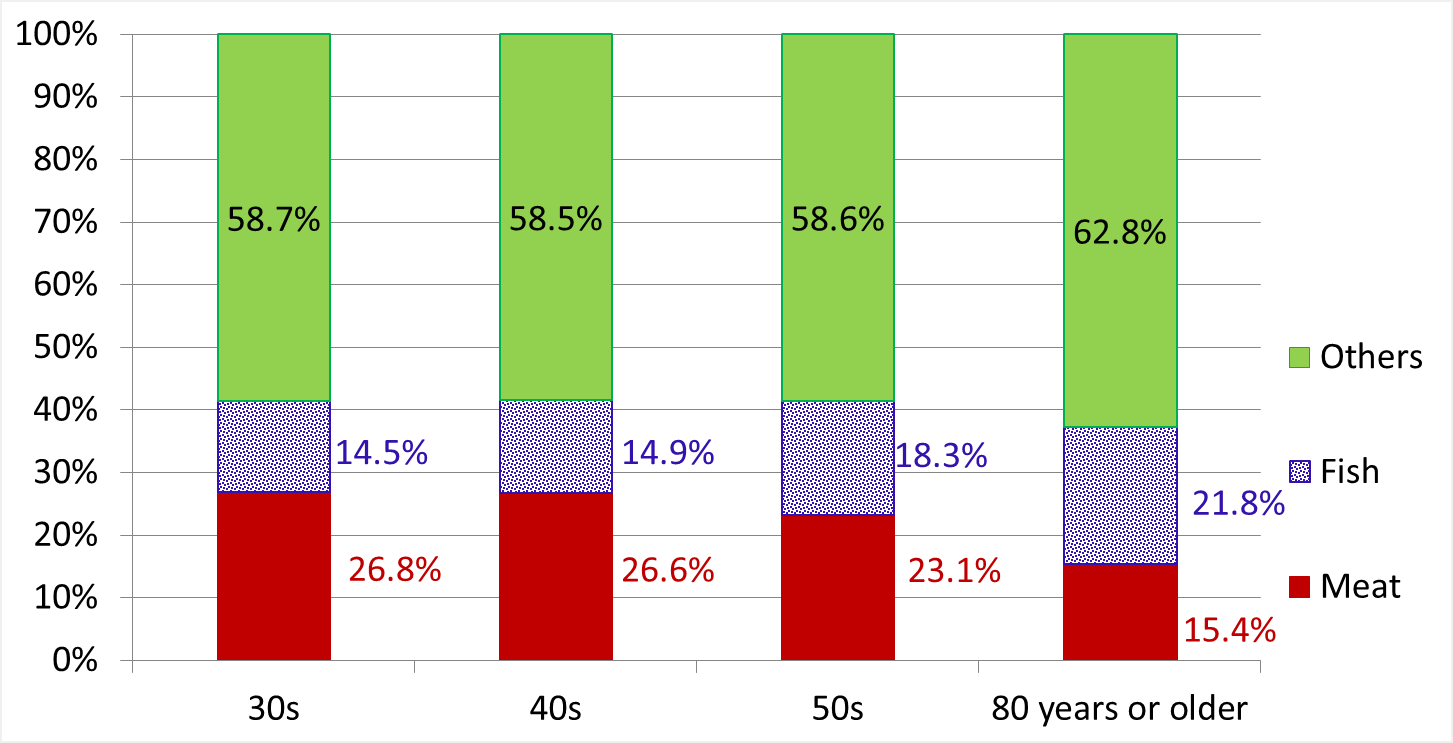
Source: Ministry of Health, Labour and Welfare