Column Finance and the Social Security System 2019.02.18
【Aging, safety net and fiscal crisis in Japan】No.158: Initial data from the national cancer registration system

The Ministry of Health, Labor and Welfare released a January 2019 report on the number of patients newly diagnosed with cancer in 2016. The Cancer Registry Promotion Law, which took effect in 2016, makes it possible to obtain the total number of cancer patients by requiring all medical institutions examining cancer patients to provide reports. The January 2019 report contains the initial statistical release for the registration system. As shown in Table 1, a total of 995,132 new cancer patients registered in 2016. Most reported cancers affected the colon, gastric areas, or lungs. Notably, patients with multiple cancers were counted for each case.
There are 47 total prefectures in Japan. The ministry calculates cancer incidence rates expressed per 100,000 people according to prefecture, cancer type, gender, and age group. The risk of developing cancer increases with age. When comparing the number of cancer patients by prefecture, the ministry therefore calculates the cancer incidence rate by adjusting the influence according to demographic variations.
As shown in Figure 1, the national average cancer incidence rate for males is 469.8. However, there is a large disparity between the Okinawa and Nagasaki prefectures (i.e., 390.4 to 540.1, respectively). Similarly, while the national average for females is 354.1, the lowest rate is in the Aichi prefecture and the highest is in the Kumamoto prefecture (i.e., 321.9 to 406.9, respectively) (Figure 2). Figure 3 shows regional differences in the rate of colon cancer, which affects the largest number of patients.
Table 1: Number of new cancer patients by organ in 2016
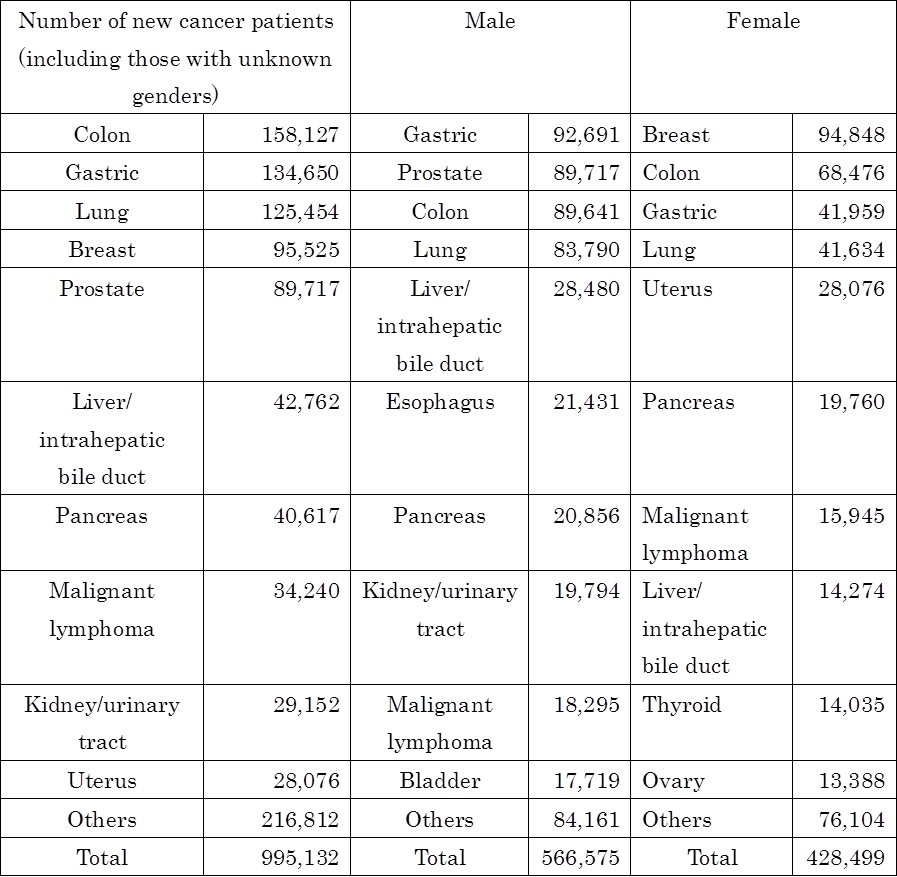
Source: Ministry of Health, Labour and Welfare
Figure 1: Regional differences in the cancer incidence rate for males
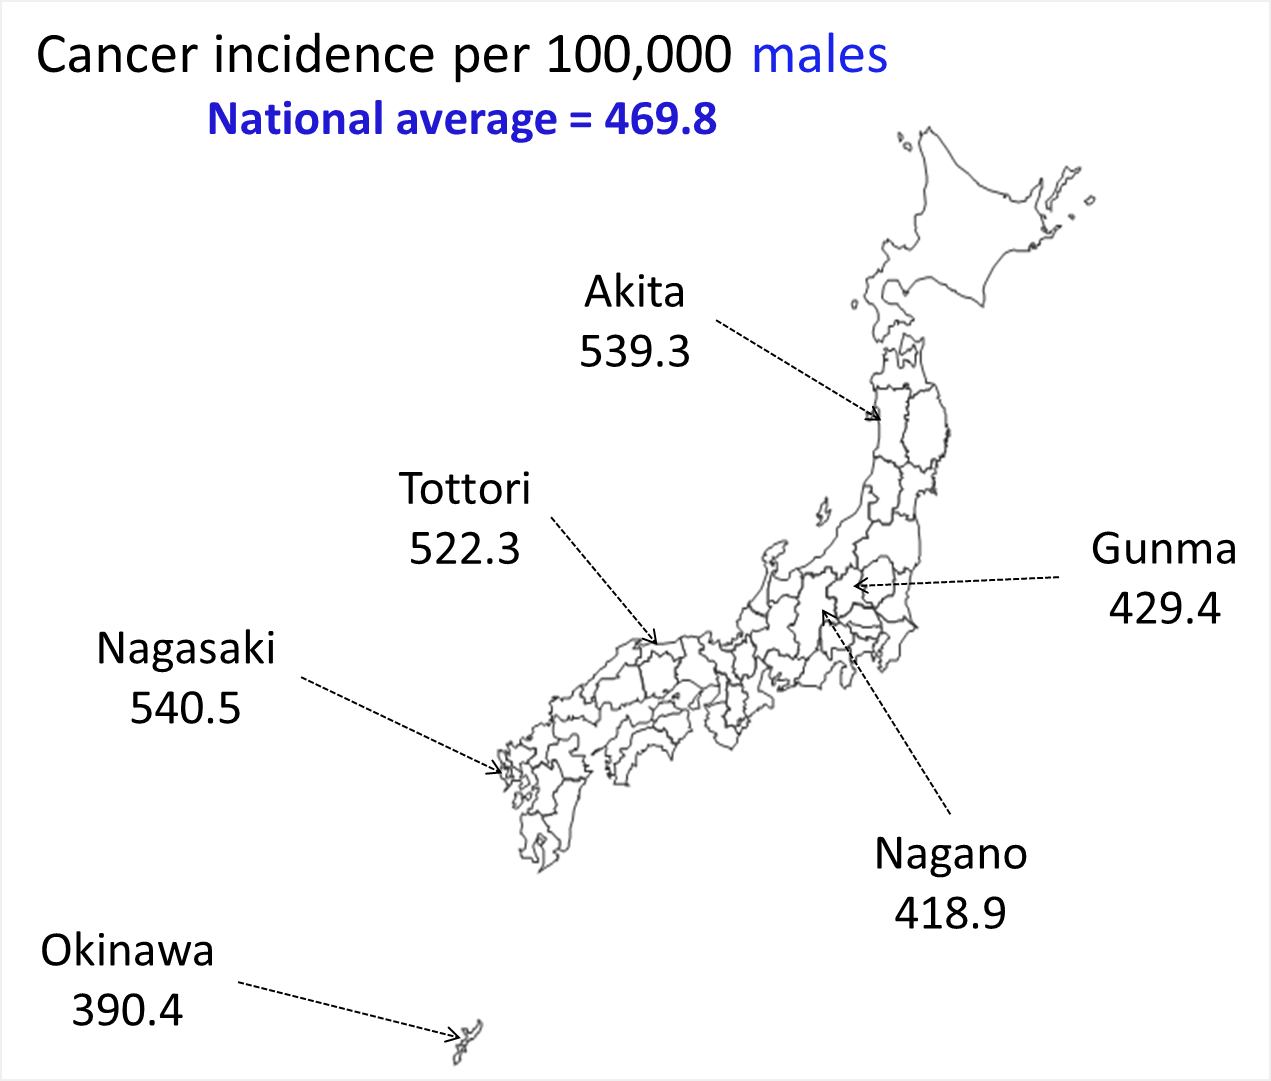
Source: Ministry of Health, Labour and Welfare
Figure 2: Regional differences in the cancer incidence rate for females
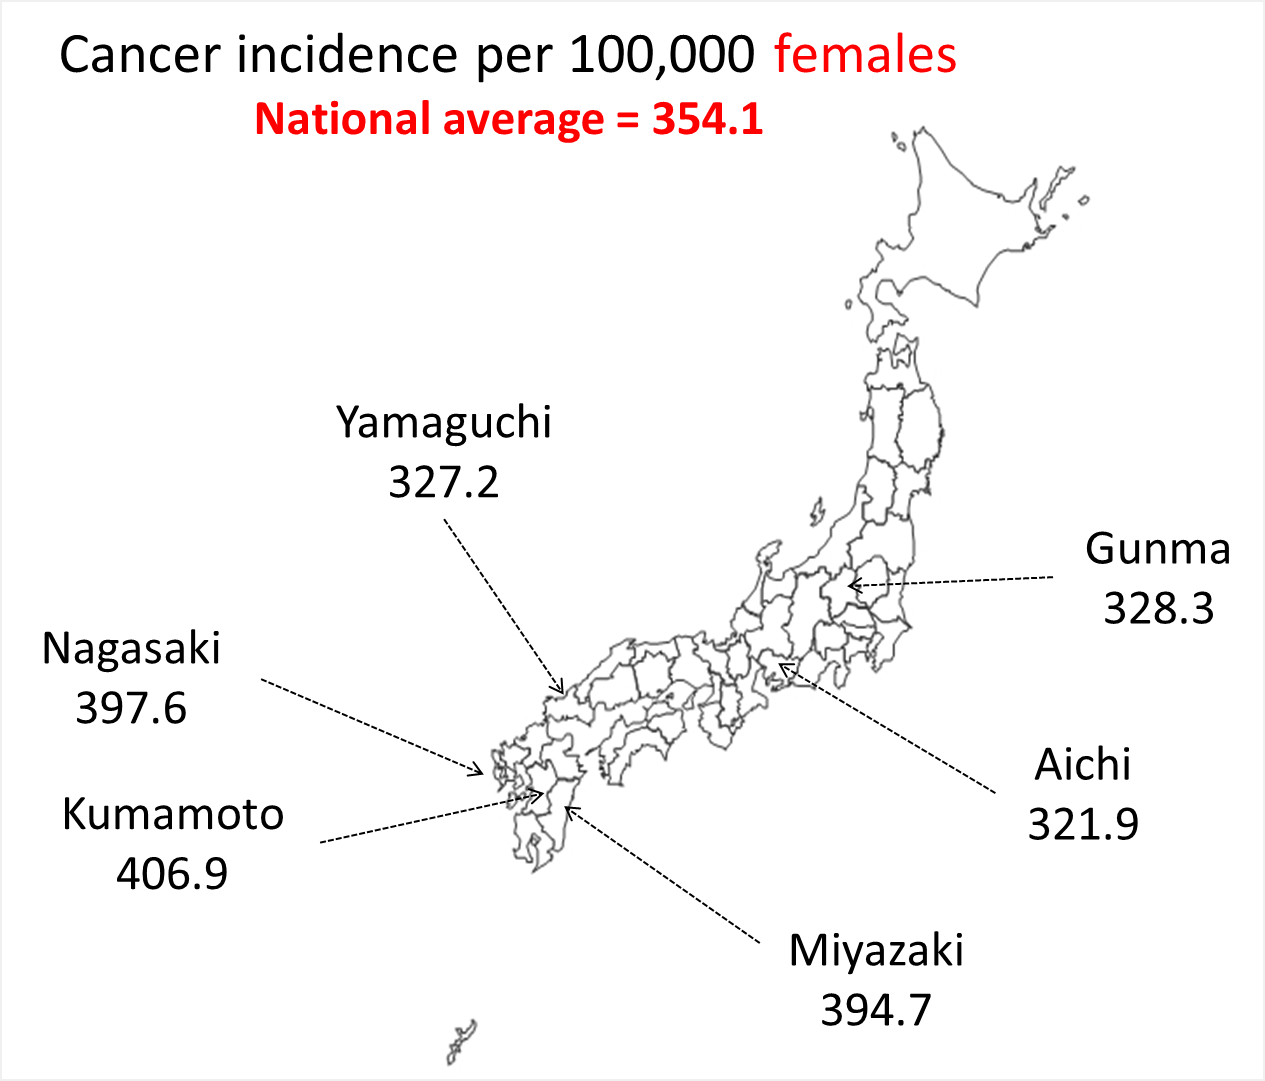
Source: Ministry of Health, Labour and Welfare
Figure 3: Regional differences in the colorectal cancer incidence rate
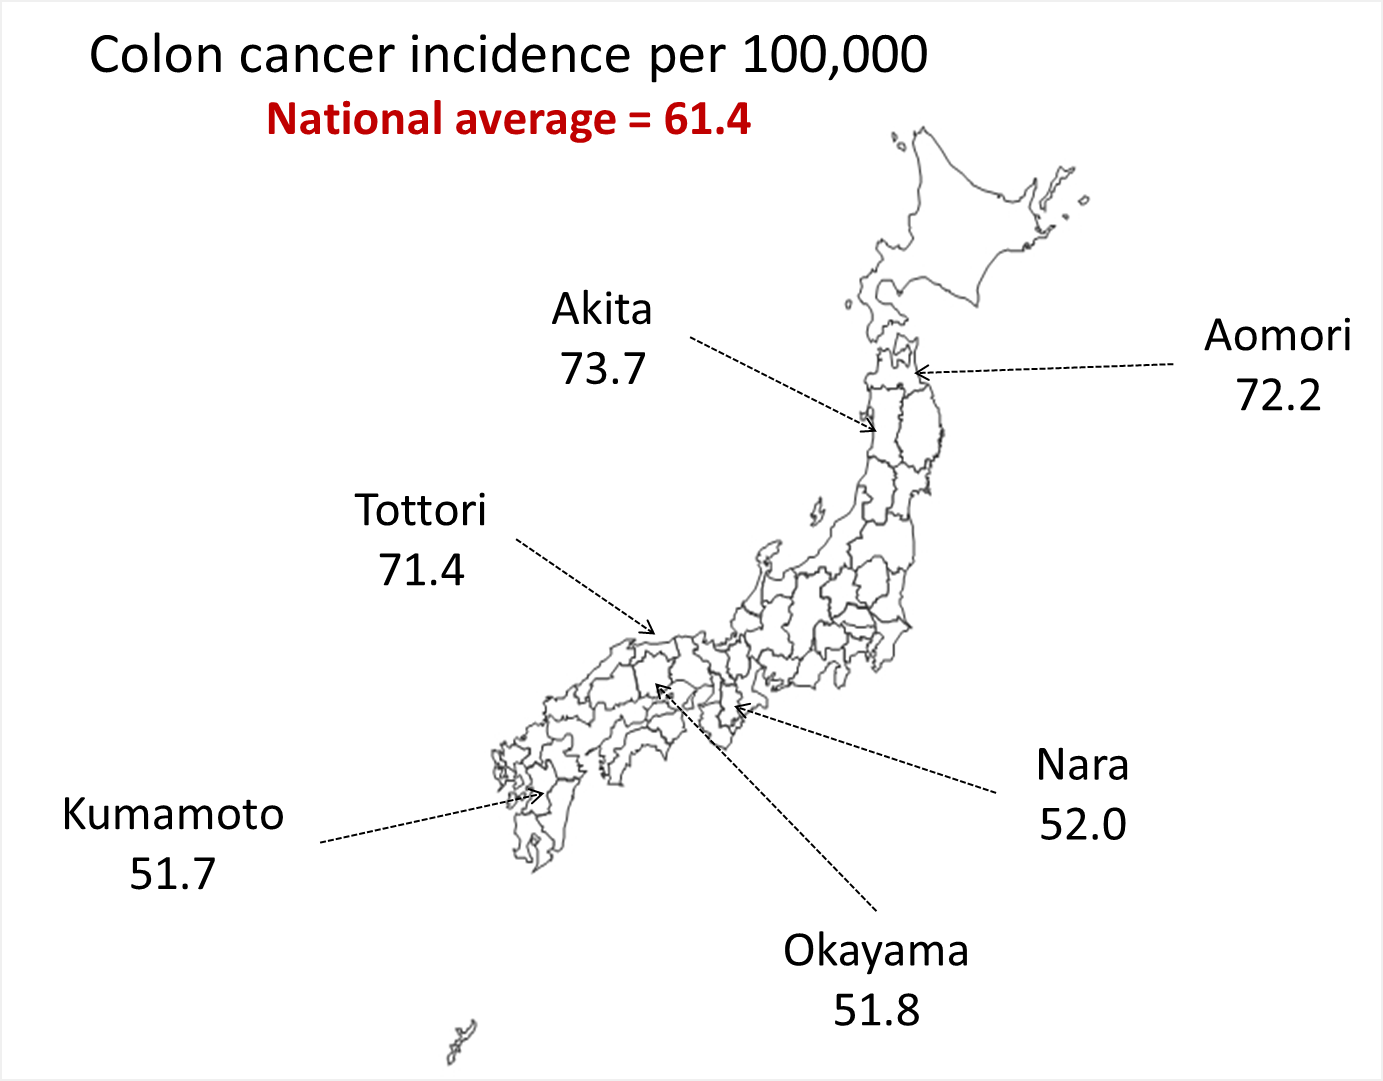
Source: Ministry of Health, Labour and Welfare