Column Finance and the Social Security System 2018.12.04
【Aging, safety net and fiscal crisis in Japan】No.140: The government's forecast of social security benefit expense is excessive

On August 2018, the National Institute of Population and Social Security Research released a report that the social security benefit expense for the fiscal year 2016 was 117 trillion yen. The social security benefit expense is a one-year government expenditure on a social security system such as pension, medical insurance, long-term care insurance, employment insurance, and welfare protection. It does not include a patient's out-of-pocket expense. The government predicts that the expenditure will reach 190 trillion yen in 2040, with expenditure for medical and long-term comprising, approximately, 94 trillion of the total expenses.
In the future, estimates are expected to accumulate with certain preconditions, and hence they will change by way of assumptions. However, there is no consistency, overall, between the various conditions premised on this estimation. Therefore, it is inappropriate as a basis for discussing fiscal reconstruction. Even if the nominal GDP growth rate becomes higher as the government expects, the 190 trillion yen will be considered excessive.
Since ratios of personnel expenses in medical and long-term care are high, the future estimate of those benefits will be significantly affected not only by inflation rate but also by the wage increase. Table 1 shows economic indicators that were prerequisite for 190 trillion yen. First, the nominal economic growth rate is set higher than the past record. Additionally, the wage increase rate is the same as the nominal economic growth rate until 2027, and it is set to be 0.9% to 1.2% higher than the nominal economic growth rate from 2028 to 2040. On the other hand, the annual average rates, for 10 years from 2006 to 2016, for nominal economic growth, consumer price inflation, and wage increase are 0.19%, 0.29%, and 0.07%, respectively. Even during 2009-2016, when the influence of negative growth caused by the Lehman shock in 2008 was eliminated, these values were 1.32%, 0.45%, and 0.45%, respectively.
Table 1: Prerequisites for prospects of social security benefit expenses (%)
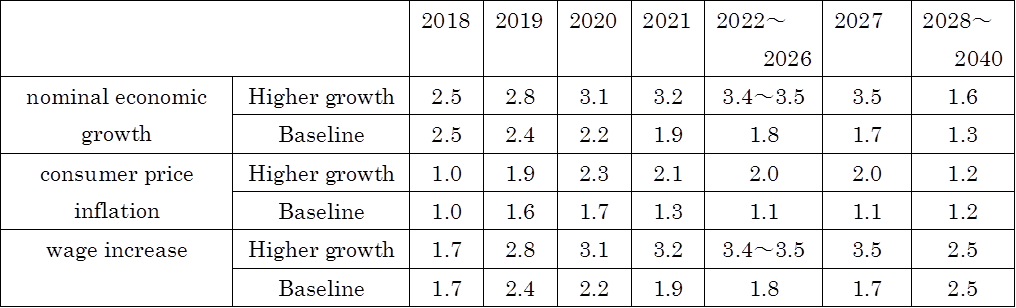
Source: Cabinet Office