Column Finance and the Social Security System 2018.04.05
【Aging, safety net and fiscal crisis in Japan】No.89: Healthy Life Expectancy

In March 2018, the Ministry of Health, Labor, and Welfare announced an estimate of healthy life expectancy (period without daily life limitations) and an estimate of the period with daily life limitations (period from the onset of long-term care to death).
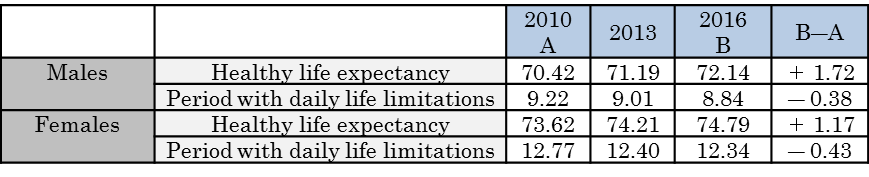
As shown in Table 1, the healthy life expectancy has increased by 1.72 years for males and by 1.17 years for females between 2010 and 2016. Since the average life expectancy in the same period increased by 1.43 years (79.55→80.98) for males and by 0.84 years (86.30→87.14) for females, the increase in healthy life expectancy exceeds the increase in average life expectancy.
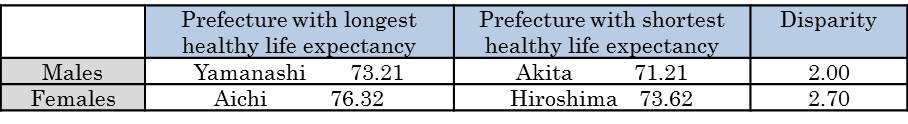
There are 47 prefectures in Japan. As shown in Table 2, the disparity in healthy life expectancy between the prefecture with the longest healthy life expectancy and that with the shortest is 2 years for males and 2.7 years for females.
(Source)Ministry of Health, Labor, and Welfare