Column Finance and the Social Security System 2018.03.30
【Aging, safety net and fiscal crisis in Japan】No.81: Revenues and Expenses of Private Nonprofit Organizations

The Cabinet Office conducts annual surveys on income, expenses, and investment of private nonprofit organizations to prepare economic statistics such as the GDP. The survey includes welfare corporations, religious corporations, educational institutions, economic organizations, labor organizations, cooperatives, etc.
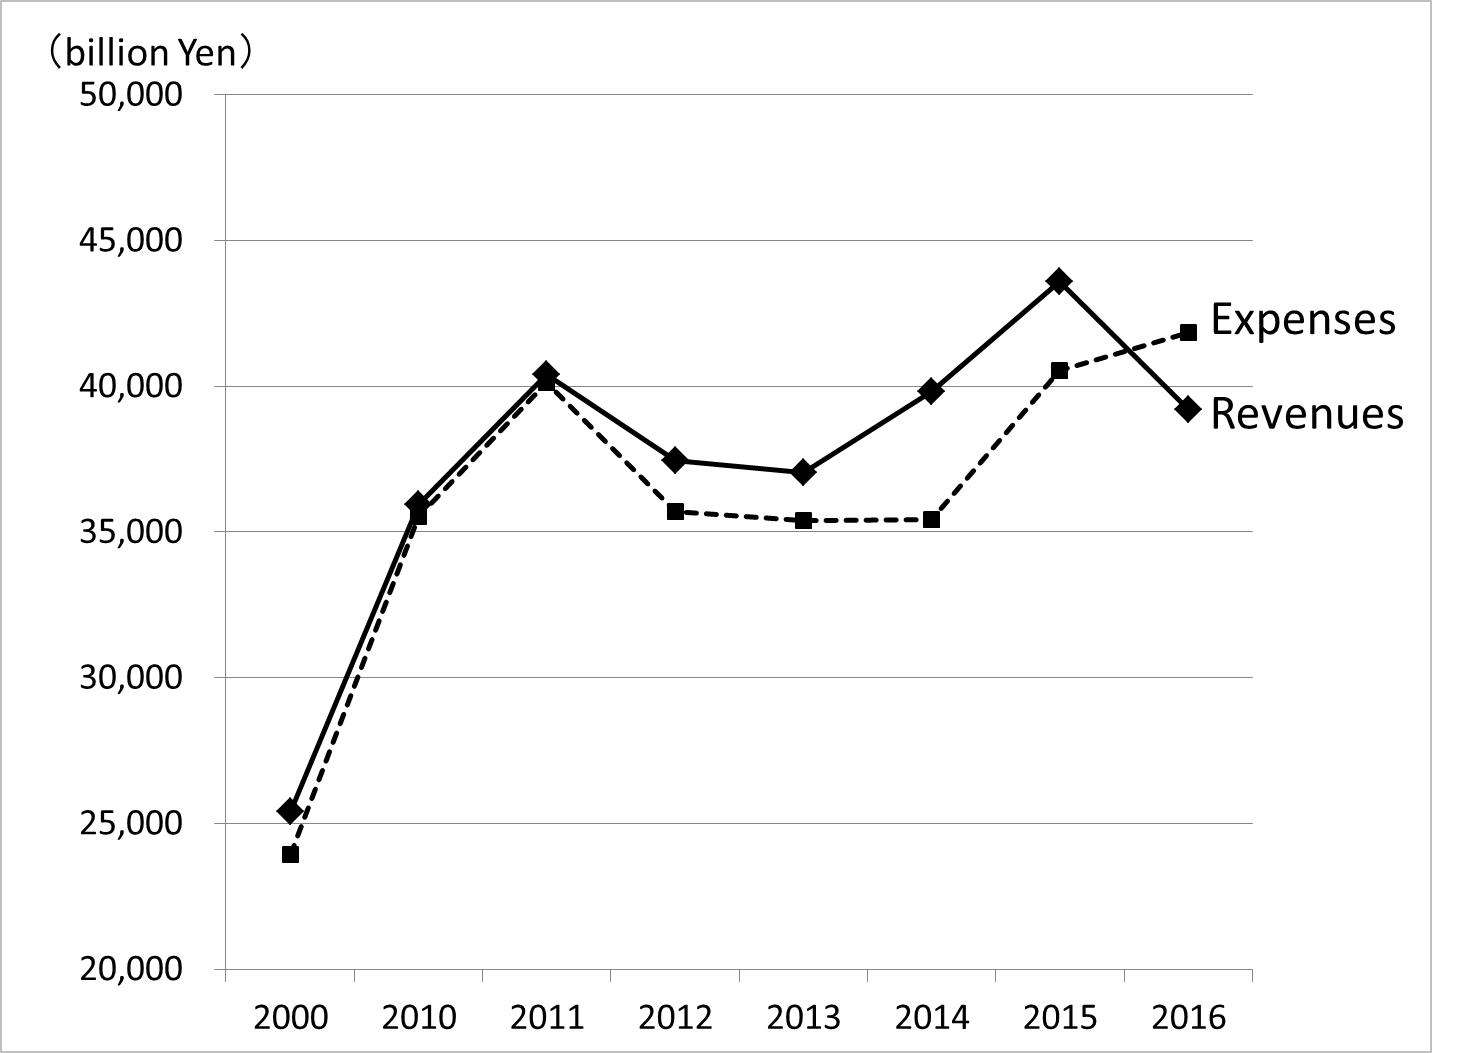
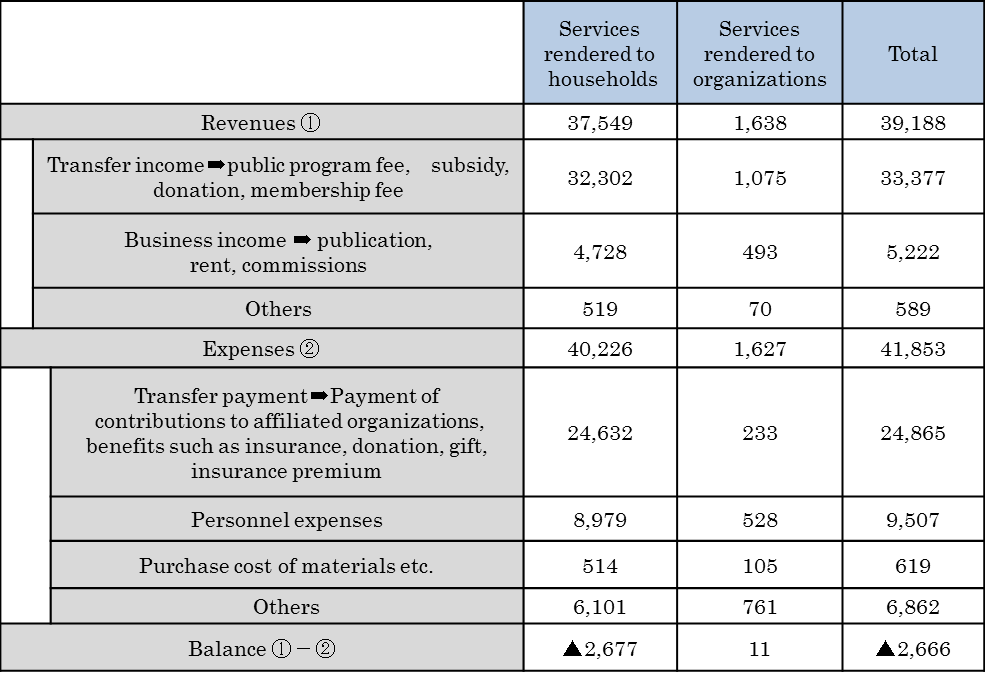
Table 1 shows the revenues and expenses in 2016 for the private nonprofit organizations. This statistic is divided into two categories, services rendered to households and services rendered to organizations, while the former accounts for the majority. In FY 2016, the revenues were 39,188 billion yen, and the expenses were 41,853 billion yen, and the balance was 2,666 billion yen in deficit. However, as shown in Figure 1, it was a surplus every year until then. The reason for the deficit was that the transfer payment in the service to households increased from 18,535 billion yen in FY 2014 to 24,632 billion yen in FY 2016, but its details are not disclosed.
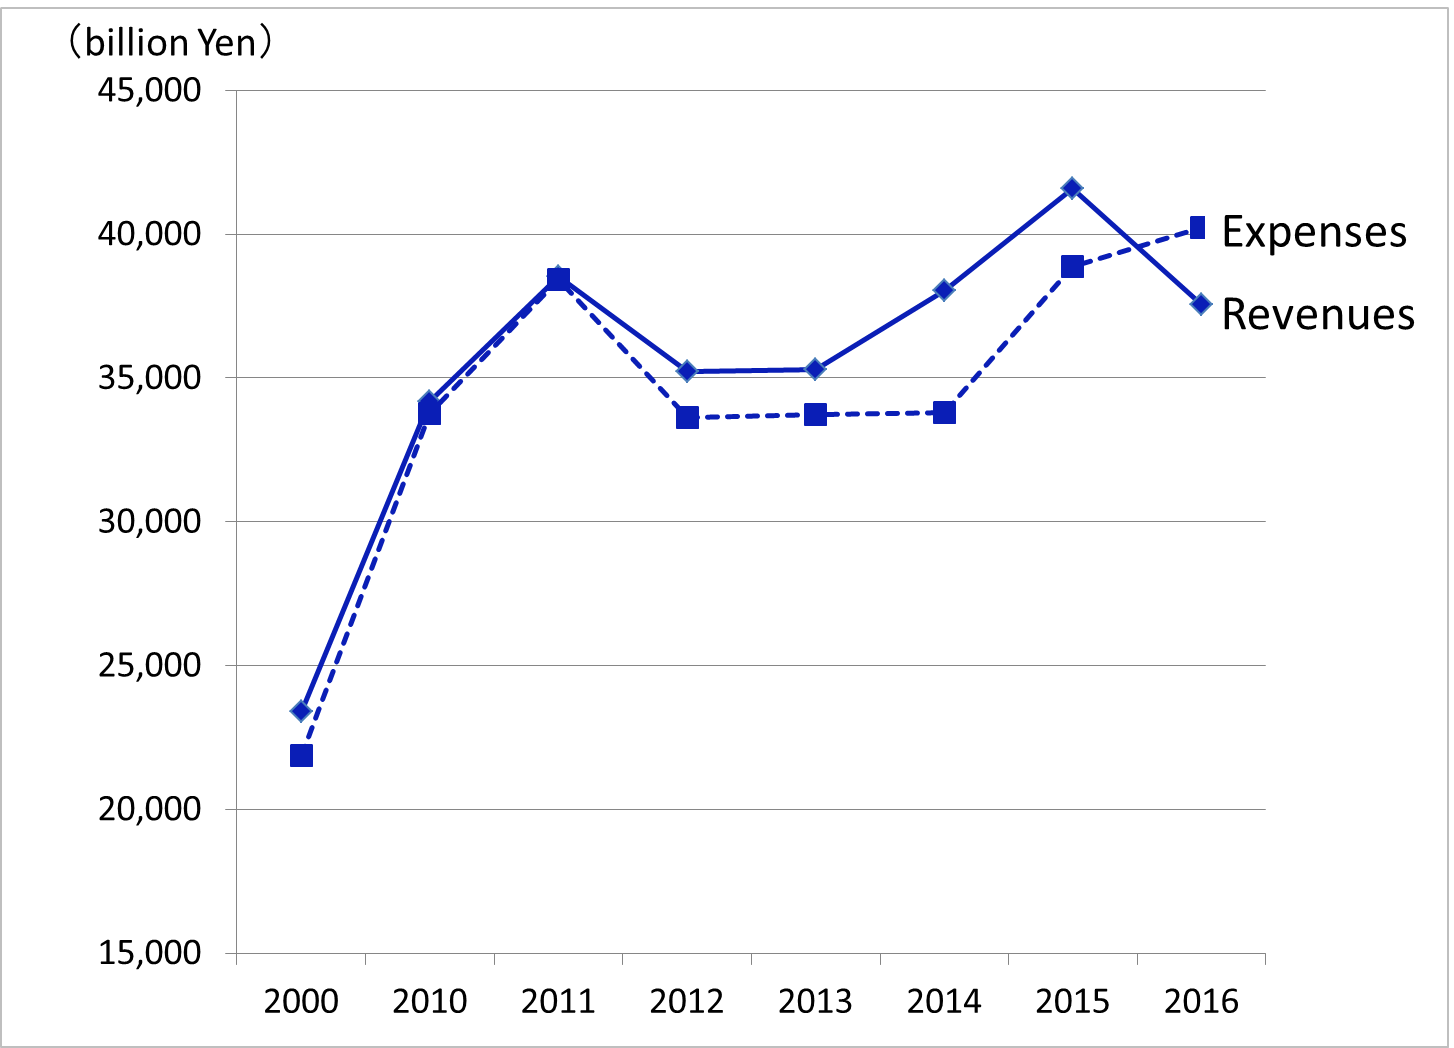
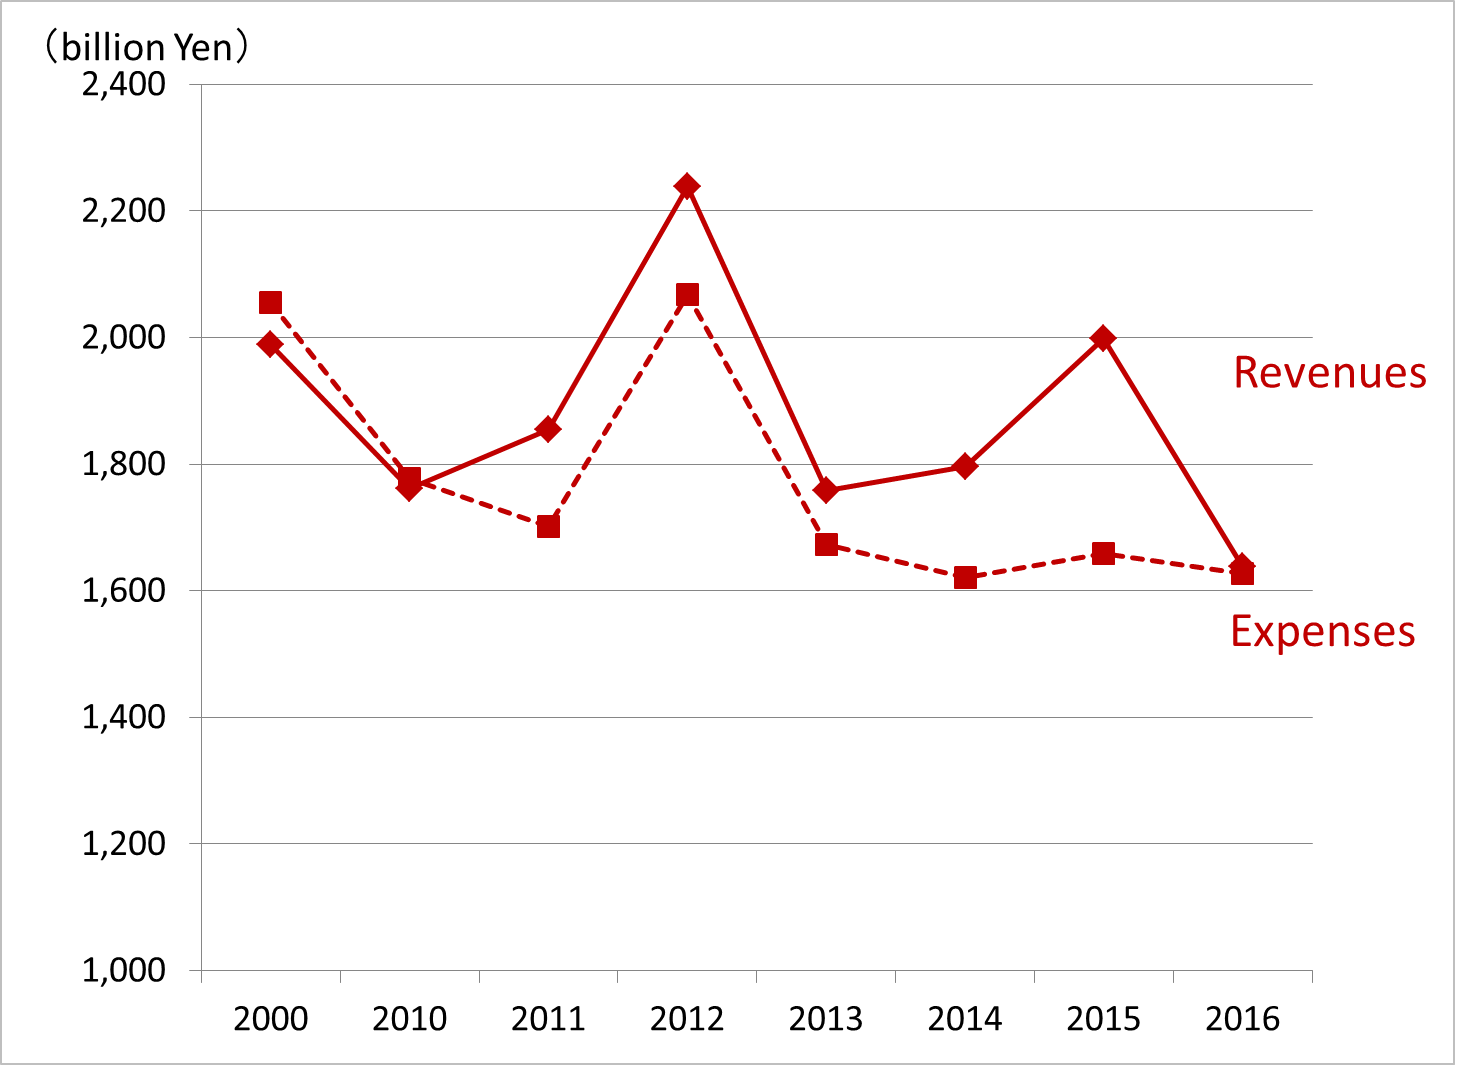
Figure 2 shows the trend of revenues and expenses in services rendered to households and Figure 3 shows the trend of revenues and expenses in the services rendered to organizations. The biggest reason why revenues in services rendered to households jumped greatly from 23,408 billion yen in 2000 to 34,166 billion yen in 2010 is the introduction of public long-term care insurance in 2000, which made it possible for private nonprofit organizations to expand long-term care business. The increase of revenues in the service to households to 38,533 billion yen in 2011 seems to reflect the increase in donations and subsidies for relief of areas afflicted by the Great East Japan Earthquake.
Source: Cabinet office