Column Finance and the Social Security System 2012.09.14
The ratio of healthcare expenditures to GDP has reached the OECD average

On August 24, the Ministry of Health, Labour and Welfare reported that approximate medical care expenditures for fiscal 2011 were 37.8 trillion yen. The figure is a quick estimation which will be finalized as National Medical Care Expenditures one year from now. Since the approximation does not include 100% of patients' out-of-pocket care costs and work-related accidents care cost and so forth, it is always less than National Medical Care Expenditures. In fiscal 2009, it was 35.3 trillion yen, which was 2.15% less than the 36.0 trillion yen of National Medical Care Expenditures. Therefore, we can estimate National Medical Care Expenditures for 2011 to be 38.6 trillion yen.
On the other hand, according to long-term care business monthly report data, Long-Term Care Expenditures for fiscal 2011 are estimated at 8.4 trillion yen. Since National Healthcare Expenditures are the combined total of National Medical Care Expenditures and Long-Term Care Expenditures, we can estimate National Healthcare Expenditures for fiscal 2011 to be 47 trillion yen. Nominal GDP for fiscal 2011 was 469.9 trillion yen. As the result, the ratio of National Healthcare Expenditures to GDP for fiscal 2011 is an estimated 10%. The ratio for fiscal 2009 was 9.11%, the lowest among OECD countries, which has jumped by 0.4-0.5 percentage points every year as National Healthcare Expenditures continue to increase at a rate exceeding that of GDP.
Furthermore, according to social security benefits forecast data released by the government last March, the ratio for fiscal 2012 seems to jump again to 10.43%, suggesting that Japan's ratio has already caught up with those of the UK and Sweden and reached the OECD average - and will probably reach number 2 globally in the next 4-5 years, just behind the U.S. Therefore, the pressure to lower unit cost of healthcare services will continue to intensify in the future, resulting in a tougher business environment for hospitals and long-term care facilities.
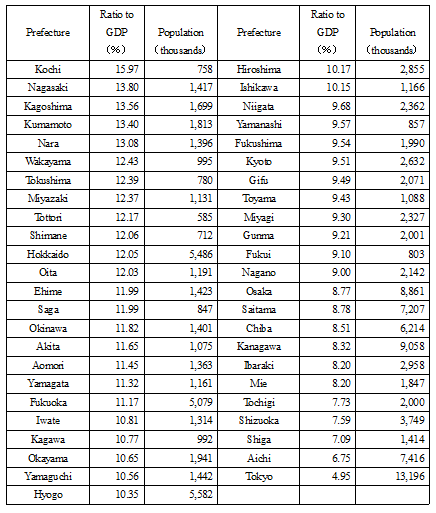
Table 1 shows the ratios of healthcare expenditures to GDP for fiscal 2009 by prefecture. There is a big difference between Tokyo's 4.95% and Kochi's 15.97%. Prefectures whose ratios far exceed the national average of 9.11% have been beleaguered by two structural problems. The first is stagnant growth in non-healthcare industries. The second is the excessive use of healthcare accompanied by a wide mismatch of healthcare needs and their delivery system. To solve the latter, Japan urgently needs to build a governance structure which integrates the management of healthcare financial resources and facility investment based on relatively broad healthcare districts. For this we can look to other OECD countries which, though their healthcare systems vary, have already created such social infrastructures.
Table 1 Ratios of healthcare expenditures to GDP by prefecture